Bitcoin Spot Order Pattern Hints at Potential Rally Amid Mixed Signals
BTC/USDT
$13,247,740,759.54
$77,853.04 / $76,516.74
Change: $1,336.30 (1.75%)
+0.0056%
Longs pay

Contents
Bitcoin’s average spot order size indicates a bullish pattern with green and red dots following downtrends, historically signaling rallies. Spot traders accumulated $113 million in BTC over two days, while perpetual markets show buyer dominance and heavy short losses.
-
Bullish spot order size pattern: Green dot after downtrend followed by red signals potential BTC uptrend.
-
Spot net purchases exceed $4.11 billion in December, reflecting strong accumulation.
-
Perpetual shorts lost $40.56 million versus $2.47 million for longs, with positive 0.0077% funding rate.
Bitcoin average spot order size signals bullish momentum amid spot buying surge and perpetual seller losses. Analyze BTC market dynamics for trading insights—stay informed on key indicators today. (152 characters)
What is Bitcoin average spot order size signaling for price?
Bitcoin average spot order size reveals a developing bullish sentiment, showing dominance shifts via bubble sizes and colors on trading charts. Historically, a green dot after a downtrend followed by a red dot has preceded significant rallies, as seen in the last three cycles. This pattern suggests stronger upward pressure ahead despite current fluctuations.
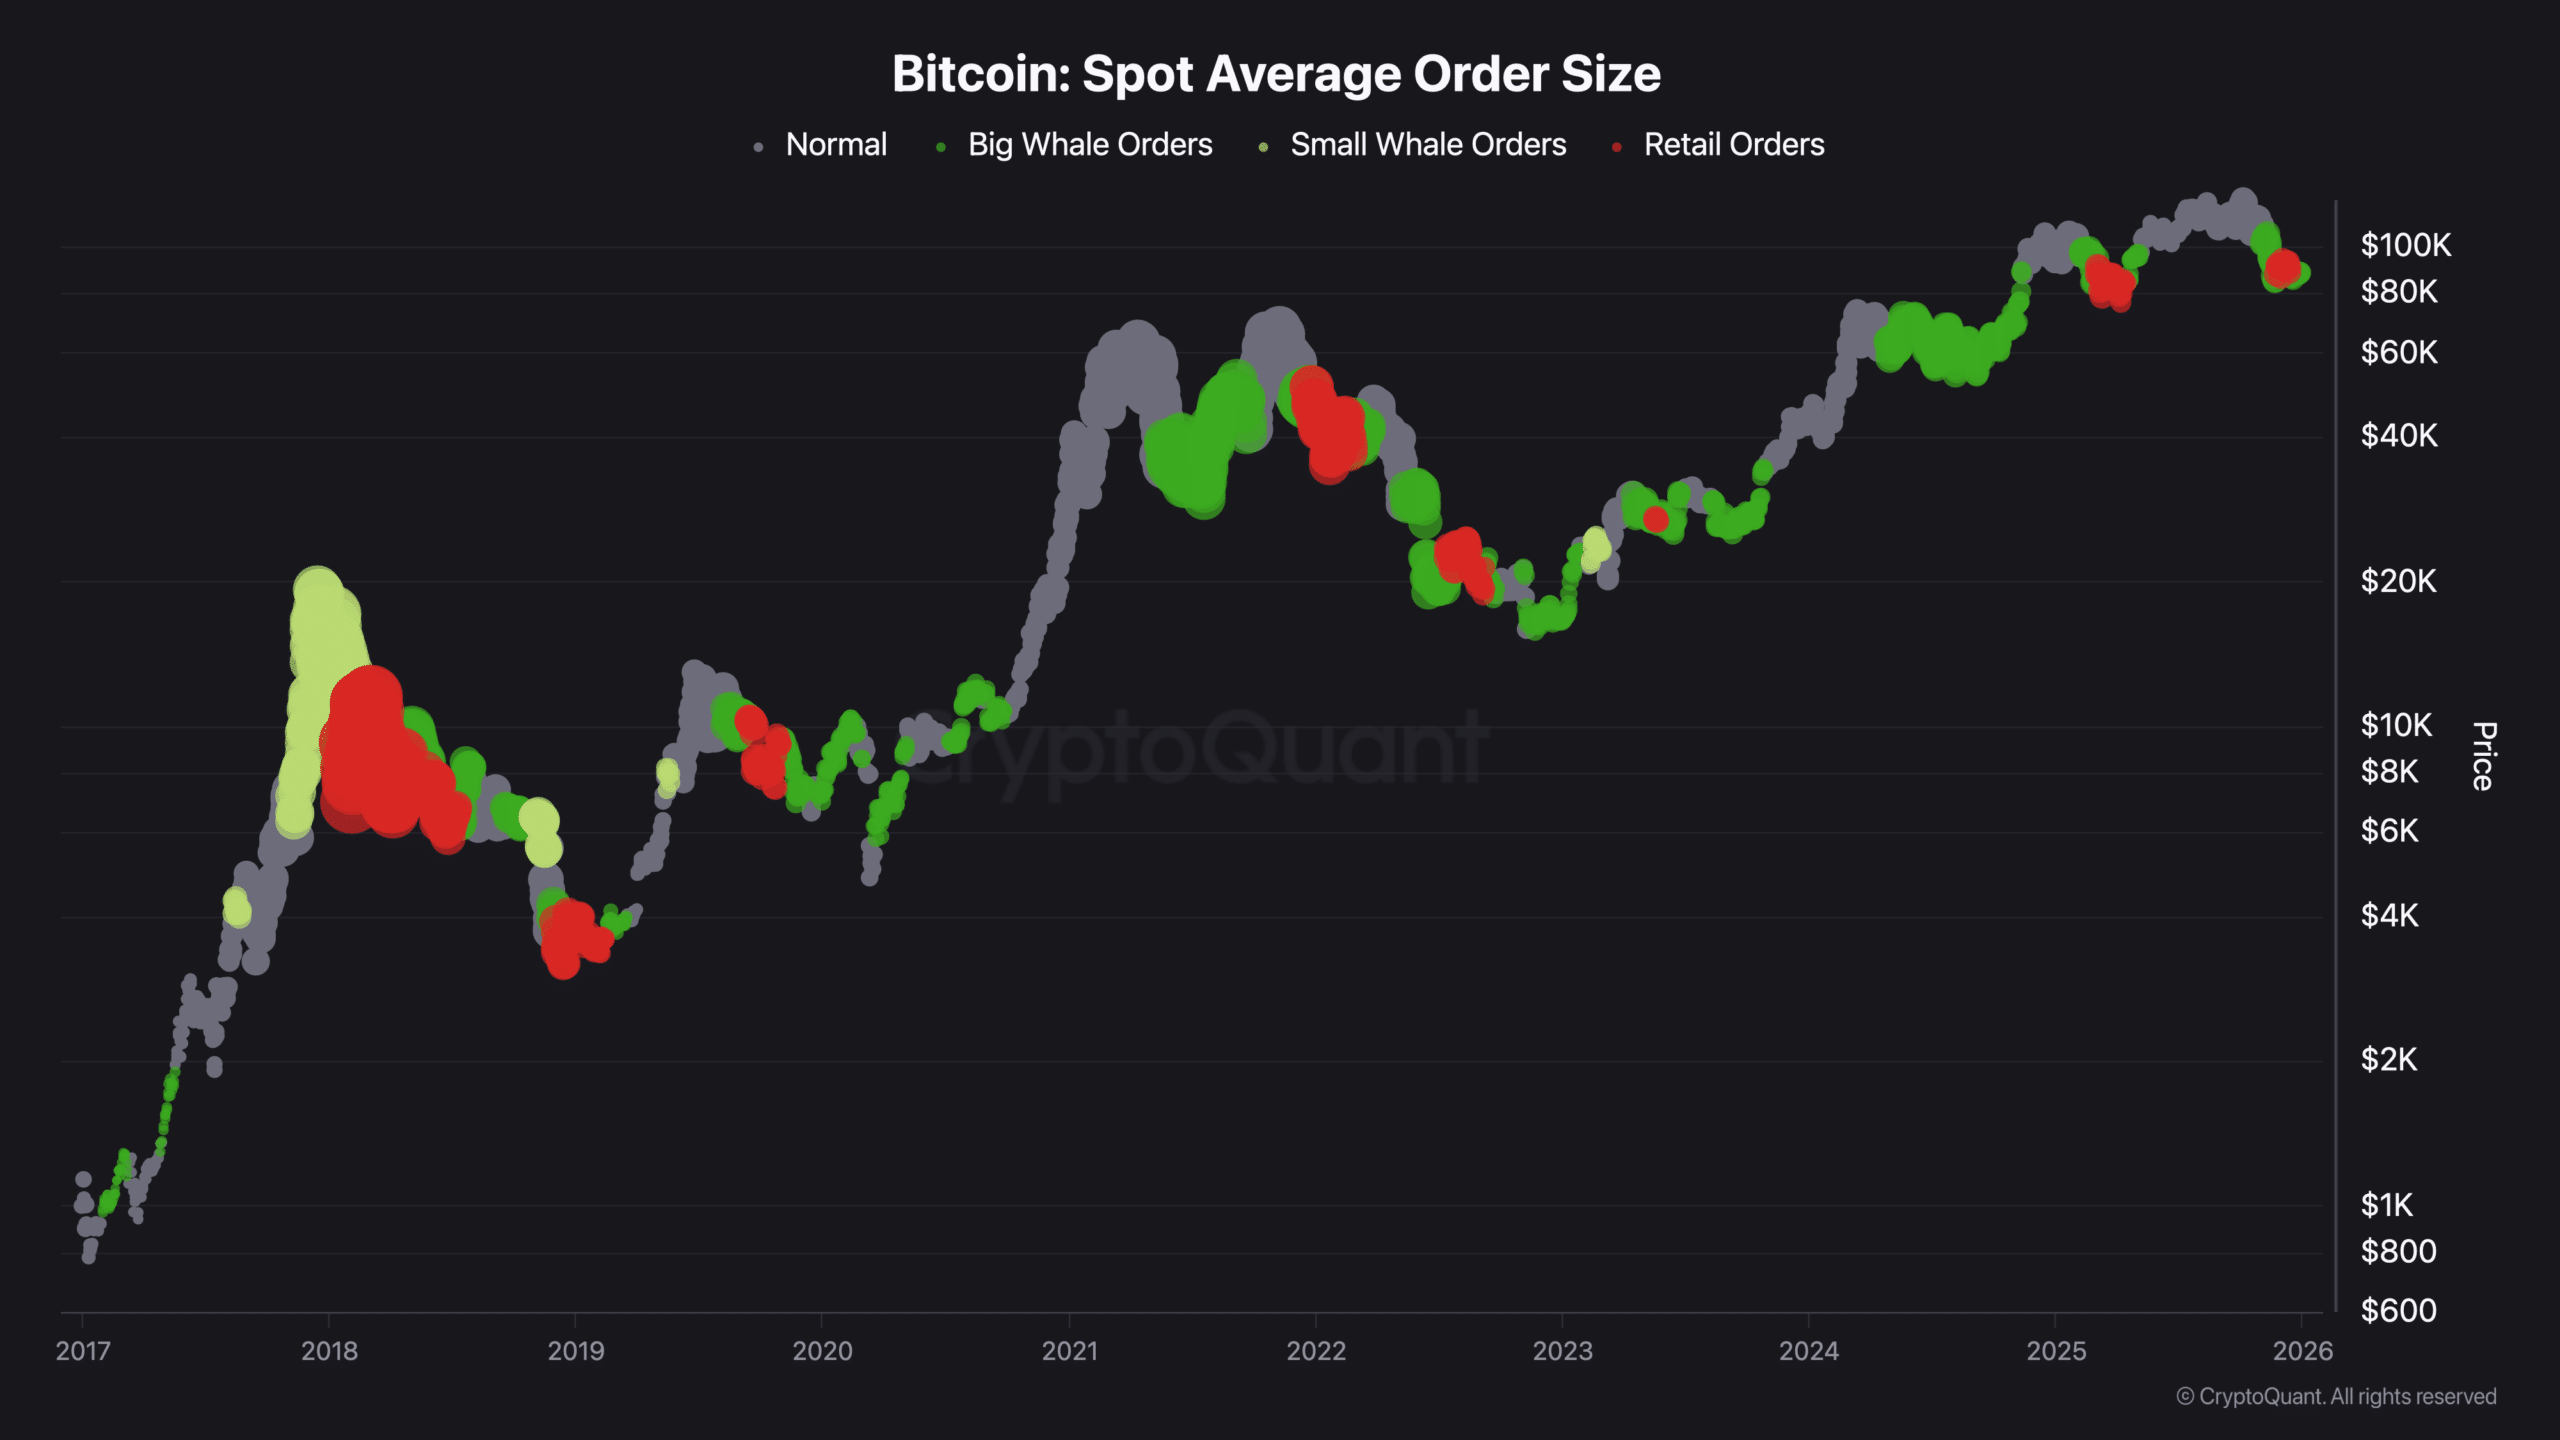
Source: CryptoQuant
Hyblock data adds nuance, with the bid-to-ask ratio trending lower. This indicates overall bullish lean among spot traders but rising bearish participation through increased sell orders. Over recent weeks, spot activity has sustained bullish bias, supporting a positive directional outlook.
How do spot and perpetual market data reflect Bitcoin sentiment?
Spot trading shows robust accumulation, with investors adding $113.23 million in Bitcoin over the past two days alone. December totals for spot purchases reached $4.11 billion per CoinGlass, underscoring strengthening sentiment. Perpetual markets align bullishly, with taker buy/sell ratio above 1, meaning buy volume outpaced sells. Total perpetual volume hit $53.23 billion, up 151% period-over-period.

Source: CoinGlass
This data highlights sustained buyer interest across segments. The average spot order size metric, tracked via platforms like CryptoQuant, measures trading dominance by visualizing order volumes. Larger bubbles denote higher activity, with colors indicating buy (green) or sell (red) pressure. Past instances confirm its predictive value for BTC price shifts.
Frequently Asked Questions
What does the Bitcoin average spot order size green dot and red dot pattern mean?
The pattern emerges after downtrends, where a green buy-dominant dot follows by a red sell-dominant one. In three prior cycles, per CryptoQuant charts, it marked rally starts with profitable phases for BTC holders. (47 words)
Are perpetual markets bullish for Bitcoin right now?
Yes, taker buy/sell ratio exceeds 1, perpetual volume rose 151% to $53.23 billion, and funding rate is positive at 0.0077%. Shorts face higher liquidation risks, supporting buyer control. (42 words)

Source: CoinGlass
Short positions suffered $40.56 million in losses against $2.47 million for longs, a 16.4:1 ratio. Positive funding rates like the current 0.0077% favor longs, promoting price stability and growth potential.
Key Takeaways
- Bullish spot pattern: Bitcoin average spot order size green-red dot sequence aligns with historical rallies.
- Strong accumulation: $4.11 billion spot buys in December, $113 million recent netflow.
- Perpetual edge: Shorts heavily liquidated; monitor funding rates for sustained upside.
Conclusion
Bitcoin’s average spot order size and perpetual metrics like funding rates and liquidation data point to bullish dominance amid mixed spot signals from bid-to-ask ratios. Data from CryptoQuant, CoinGlass, and Hyblock provide clear evidence of buyer strength. Track these indicators closely as market activity evolves for strategic positioning in BTC trading.
Add COINOTAG as a Preferred Source
Add COINOTAG to your preferred sources in Google News and Search to see our coverage first.
Add on Google