Polkadot Shows Short-Term Bullish Momentum Amid Long-Term Bearish Trend
BTC/USDT
$13,249,103,576.68
$77,853.04 / $76,516.74
Change: $1,336.30 (1.75%)
+0.0056%
Longs pay

Contents
Polkadot DOT price analysis shows a persistent long-term bearish trend since March 2025, with weekly charts confirming selling pressure. Yet, DOT achieved 4.41% gains last week, driven by bullish 4-hour structural breaks, potentially targeting $2.00-$2.50 amid Bitcoin volatility.
-
Weekly timeframe: Bearish structure intact with ongoing breaks since September 2025.
-
4-hour chart signals bullish shift via breaches of $1.75-$1.85 lower highs.
-
Accumulation/Distribution indicator rises, Awesome Oscillator confirms momentum; Bitcoin $90k resistance adds caution.
Polkadot DOT price analysis: 4.41% weekly gain in bearish trend. Multi-timeframe insights reveal short-term bullish potential to $2.5. Trading tips and risks amid BTC fear. Stay informed on DOT trends today.
What is the Polkadot DOT price trend in 2025?
Polkadot DOT price analysis indicates a dominant long-term bearish trajectory since March 2025, marked by consistent downward swings. Despite this, recent 4.41% weekly appreciation highlights short-term resilience, fueled by 4-hour bullish momentum. Traders eye $2 resistance, though higher-timeframe pressures persist.
How does multi-timeframe analysis impact DOT price outlook?
Multi-timeframe evaluation of Polkadot DOT price analysis underscores key divergences. Weekly charts depict unbroken bearish architecture from September, with Accumulation/Distribution reflecting sustained selling and Awesome Oscillator signaling negative momentum. A $2.5 imbalance zone may act as supply before further declines on this scale.
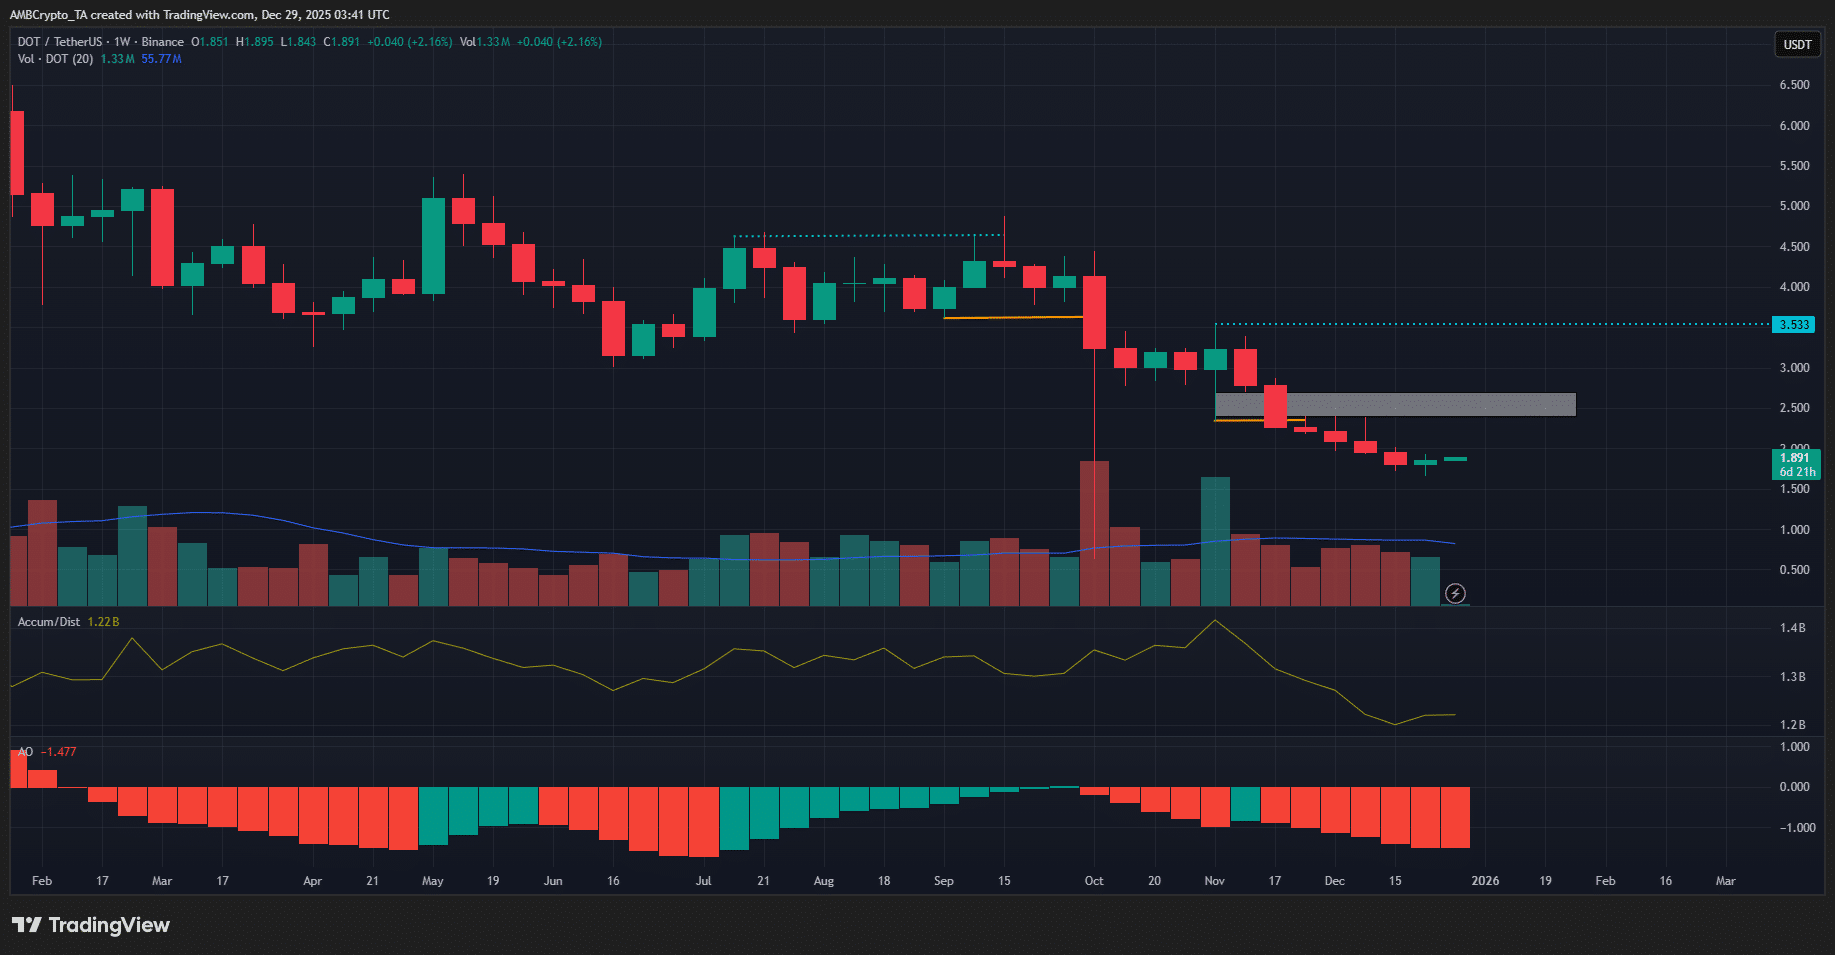
Source: DOT/USDT on TradingView
In contrast, the 4-hour timeframe reveals a bullish reversal over the past week. Key structural breaks exceeded prior lower highs at $1.75 and $1.85. Rising Accumulation/Distribution and positive Awesome Oscillator bars suggest upward continuation toward $2 psychological resistance or even the weekly $2.5 supply area.
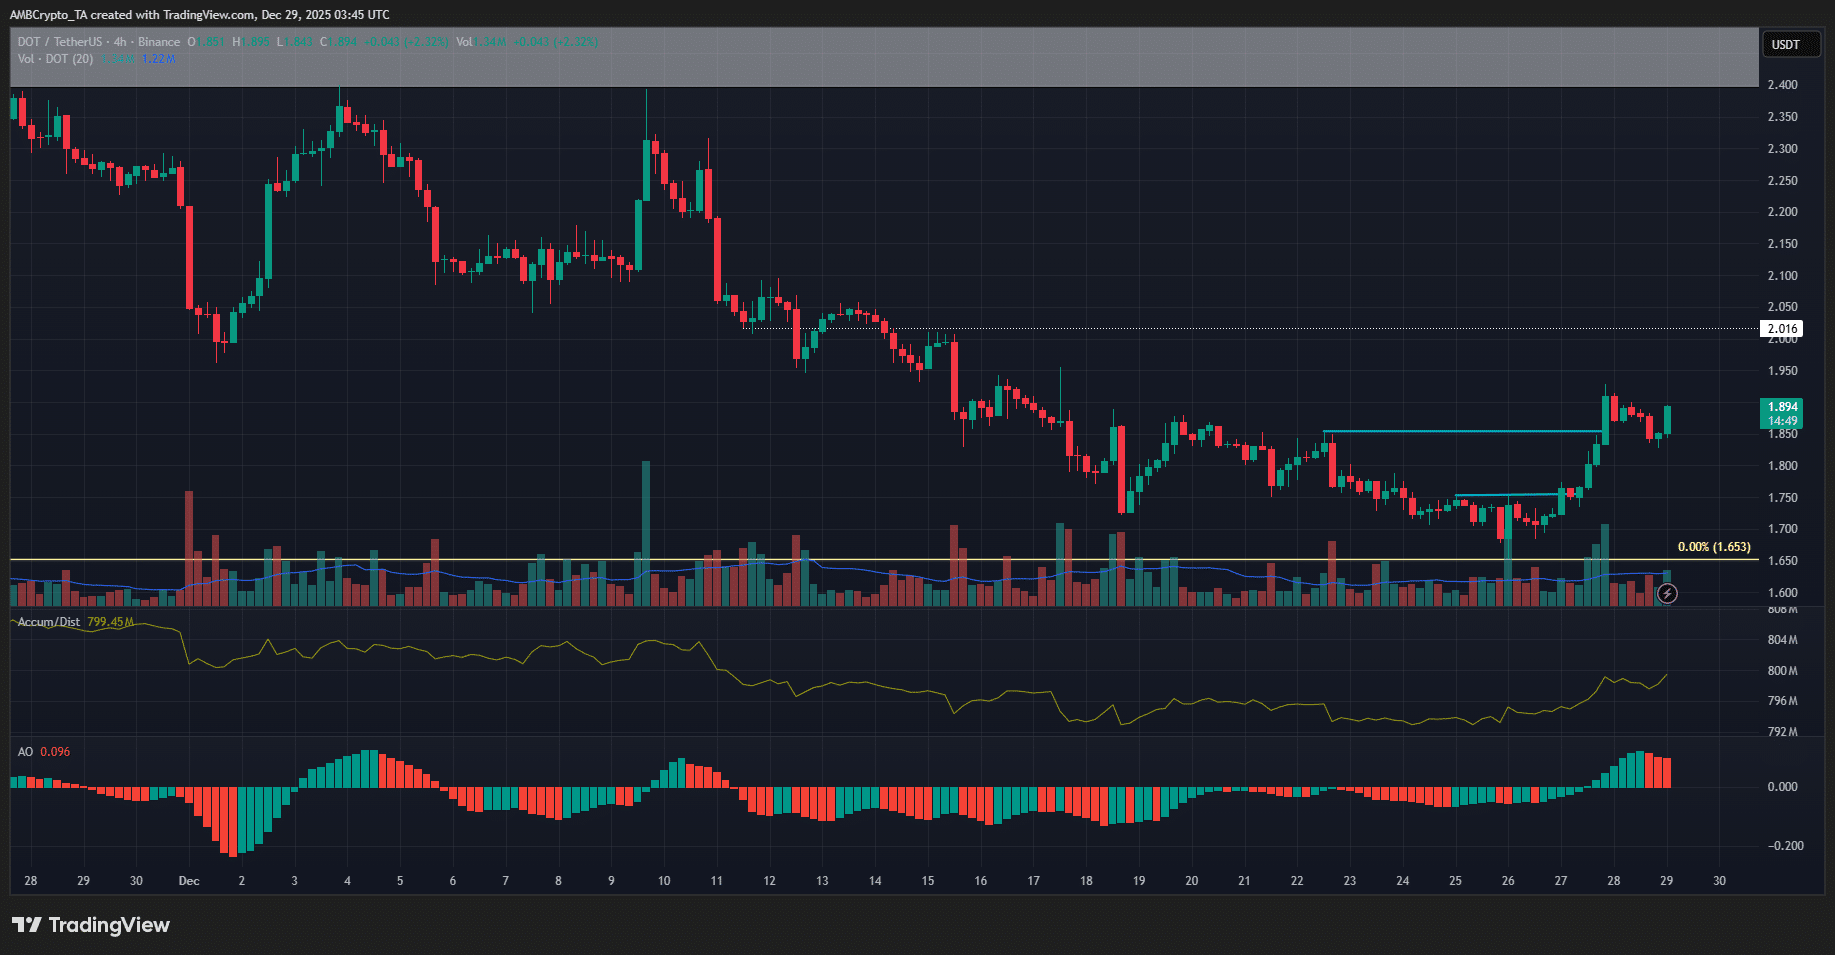
Source: DOT/USDT on TradingView
Frequently Asked Questions
Will Polkadot DOT price reach $2 in the short term during 2025 bearish trend?
Polkadot’s 4-hour bullish momentum supports a push to $2.00-$2.11, backed by liquidation clusters and structural breaks. However, weekly bearish dominance suggests this as a bounce target, not reversal. Risk-averse traders should monitor $1.82 support for invalidation.
Is Polkadot a good buy now with Bitcoin at $90k resistance?
Short-term traders may capitalize on DOT’s bounce, but long-term investors face elevated risks from Bitcoin’s $90k barrier and fearful market sentiment. Higher-timeframe selling pressure outweighs immediate gains; sidelining remains prudent until demand strengthens.
Bitcoin’s $90k resistance remains a formidable hurdle for bulls, constraining liquidity despite recent inflows. Altcoins like Polkadot encounter spillover effects, limiting sustained rallies. While 4-hour trends favor upside, overarching bearish weekly patterns demand caution for extended positions.
The dangers for DOT bulls in current market conditions
Short-term positivity on lower timeframes does not erase higher-timeframe bearishness. Polkadot bulls risk entrapment if Bitcoin fails at $90k, triggering altcoin corrections. Demand remains thin amid widespread fear, underscoring the need for precise entry and exit strategies.
Traders’ call to action – Capitalizing on Polkadot’s potential bounce
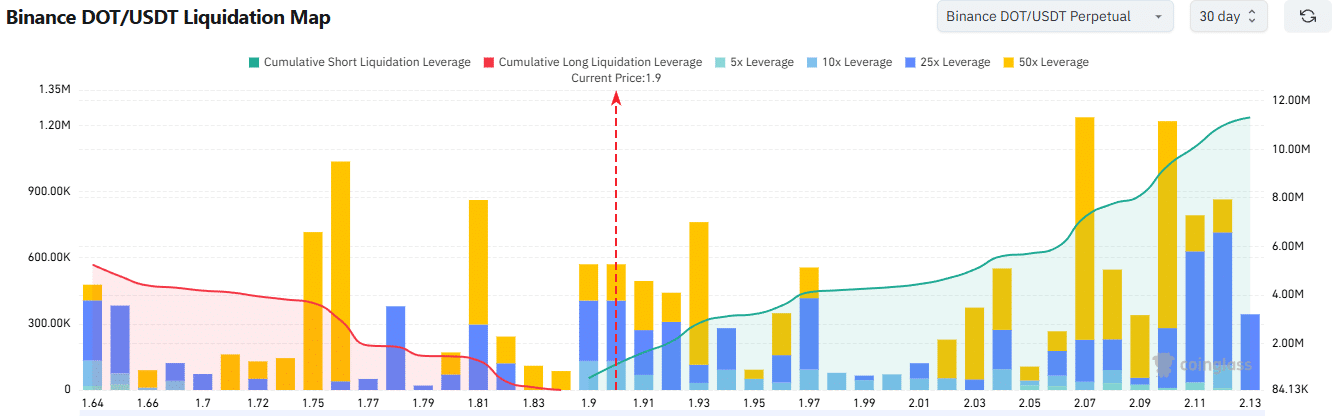
Source: CoinGlass
Conservative approaches favor observation given weekly bearishness. The 4-hour uptrend eyes $2.11, where 30-day liquidation maps highlight dense short positions. Price often hunts liquidity here, offering profit opportunities at $2.00-$2.10. Breaches below $1.82 negate bullish setups.
Key Takeaways
- Short-term opportunity: Lower timeframe traders can profit from DOT bounce to $2-$2.5 zones.
- Long-term caution: Weekly bearish trend and Bitcoin resistance signal limited upside sustainability.
- Risk management: Use $1.82 invalidation; target liquidation-driven highs for exits.
Conclusion
This Polkadot DOT price analysis highlights short-term bullish signals clashing with entrenched bearish multi-timeframe trends since March 2025. While 4.41% weekly gains and 4-hour momentum offer trading prospects, Bitcoin headwinds and light demand warrant vigilance. Monitor key levels for informed decisions in volatile crypto markets.
Disclaimer: The information presented does not constitute financial, investment, trading, or other types of advice and is solely the writer’s opinion.
Add COINOTAG as a Preferred Source
Add COINOTAG to your preferred sources in Google News and Search to see our coverage first.
Add on Google