Bitcoin Unrealized Losses Reach $85B as Crypto Market Braces for Heightened Volatility
BTC/USDT
$28,834,738,693.32
$80,900.00 / $78,202.00
Change: $2,698.00 (3.45%)
-0.0043%
Shorts pay

Contents
Crypto unrealized losses have surged to $350 billion across the market, with Bitcoin contributing $85 billion, amid thinning liquidity that signals heightened volatility into early 2026. However, substantial unrealized profits persist, indicating market stress rather than a full breakdown. Investors should brace for sharper price swings as liquidity contracts.
-
Unrealized losses hit $350 billion total, up sharply from recent months.
-
Bitcoin’s share stands at $85 billion, concentrated among late-cycle buyers who entered near peaks.
-
Despite losses, unrealized profits remain in the hundreds of billions, supporting long-term holder positions; liquidity decline amplifies volatility risks, per Glassnode data.
Crypto unrealized losses climb to $350B as Bitcoin faces $85B hit—explore liquidity crunch and profit resilience for 2026 volatility outlook. Stay informed on market stress signals.
What are crypto unrealized losses and how do they impact the market?
Crypto unrealized losses represent the difference between an asset’s current market value and its average purchase price for holders who are underwater, totaling around $350 billion ecosystem-wide as of late 2025, according to Glassnode analytics. These losses have spiked due to recent price pullbacks from Bitcoin’s $120,000 high, particularly affecting newer entrants. While they signal short-term stress, the market’s structure remains resilient with unrealized profits far outweighing losses overall.
How do unrealized profits balance the picture of crypto unrealized losses?
The unrealized profit dataset from Glassnode reveals a contrasting view, with profits across cryptocurrencies still hovering in the hundreds of billions despite some retracement from 2025 peaks. This imbalance shows that long-term holders, who accumulated earlier in the cycle, continue to enjoy substantial gains, insulating the market from systemic insolvency. For instance, Bitcoin’s unrealized profits dwarf its $85 billion in losses when examined over a two-year horizon, a pattern observed in prior bull-cycle corrections. Expert analysis from on-chain metrics firms like Glassnode emphasizes that this profit dominance prevents broad capitulation, though thinning liquidity—marked by reduced stablecoin inflows and exchange volumes—could exacerbate volatility. Short sentences highlight the structure: profits provide a buffer; losses reflect tactical pain; combined, they suggest consolidation rather than collapse. Historical data supports this, as similar divergences in 2021 led to recoveries after liquidity stabilized.
New data from Glassnode indicates that unrealized losses across the crypto market have climbed to roughly $350 billion, with Bitcoin accounting for around $85 billion of that total.
Combined with multiple liquidity indicators pointing sharply lower, the market appears to be entering a heightened-volatility phase that could shape price action into early 2026.
But a second dataset, unrealized profits across the ecosystem, paints a more nuanced picture of investor positioning.
Unrealized losses spike — and signal growing market stress
The unrealized-loss heatmap indicates a broad rise in red bands across assets, suggesting that more wallets are now holding underwater positions compared to recent months.
Total unrealized losses are now near the highest levels seen at any point in 2025.
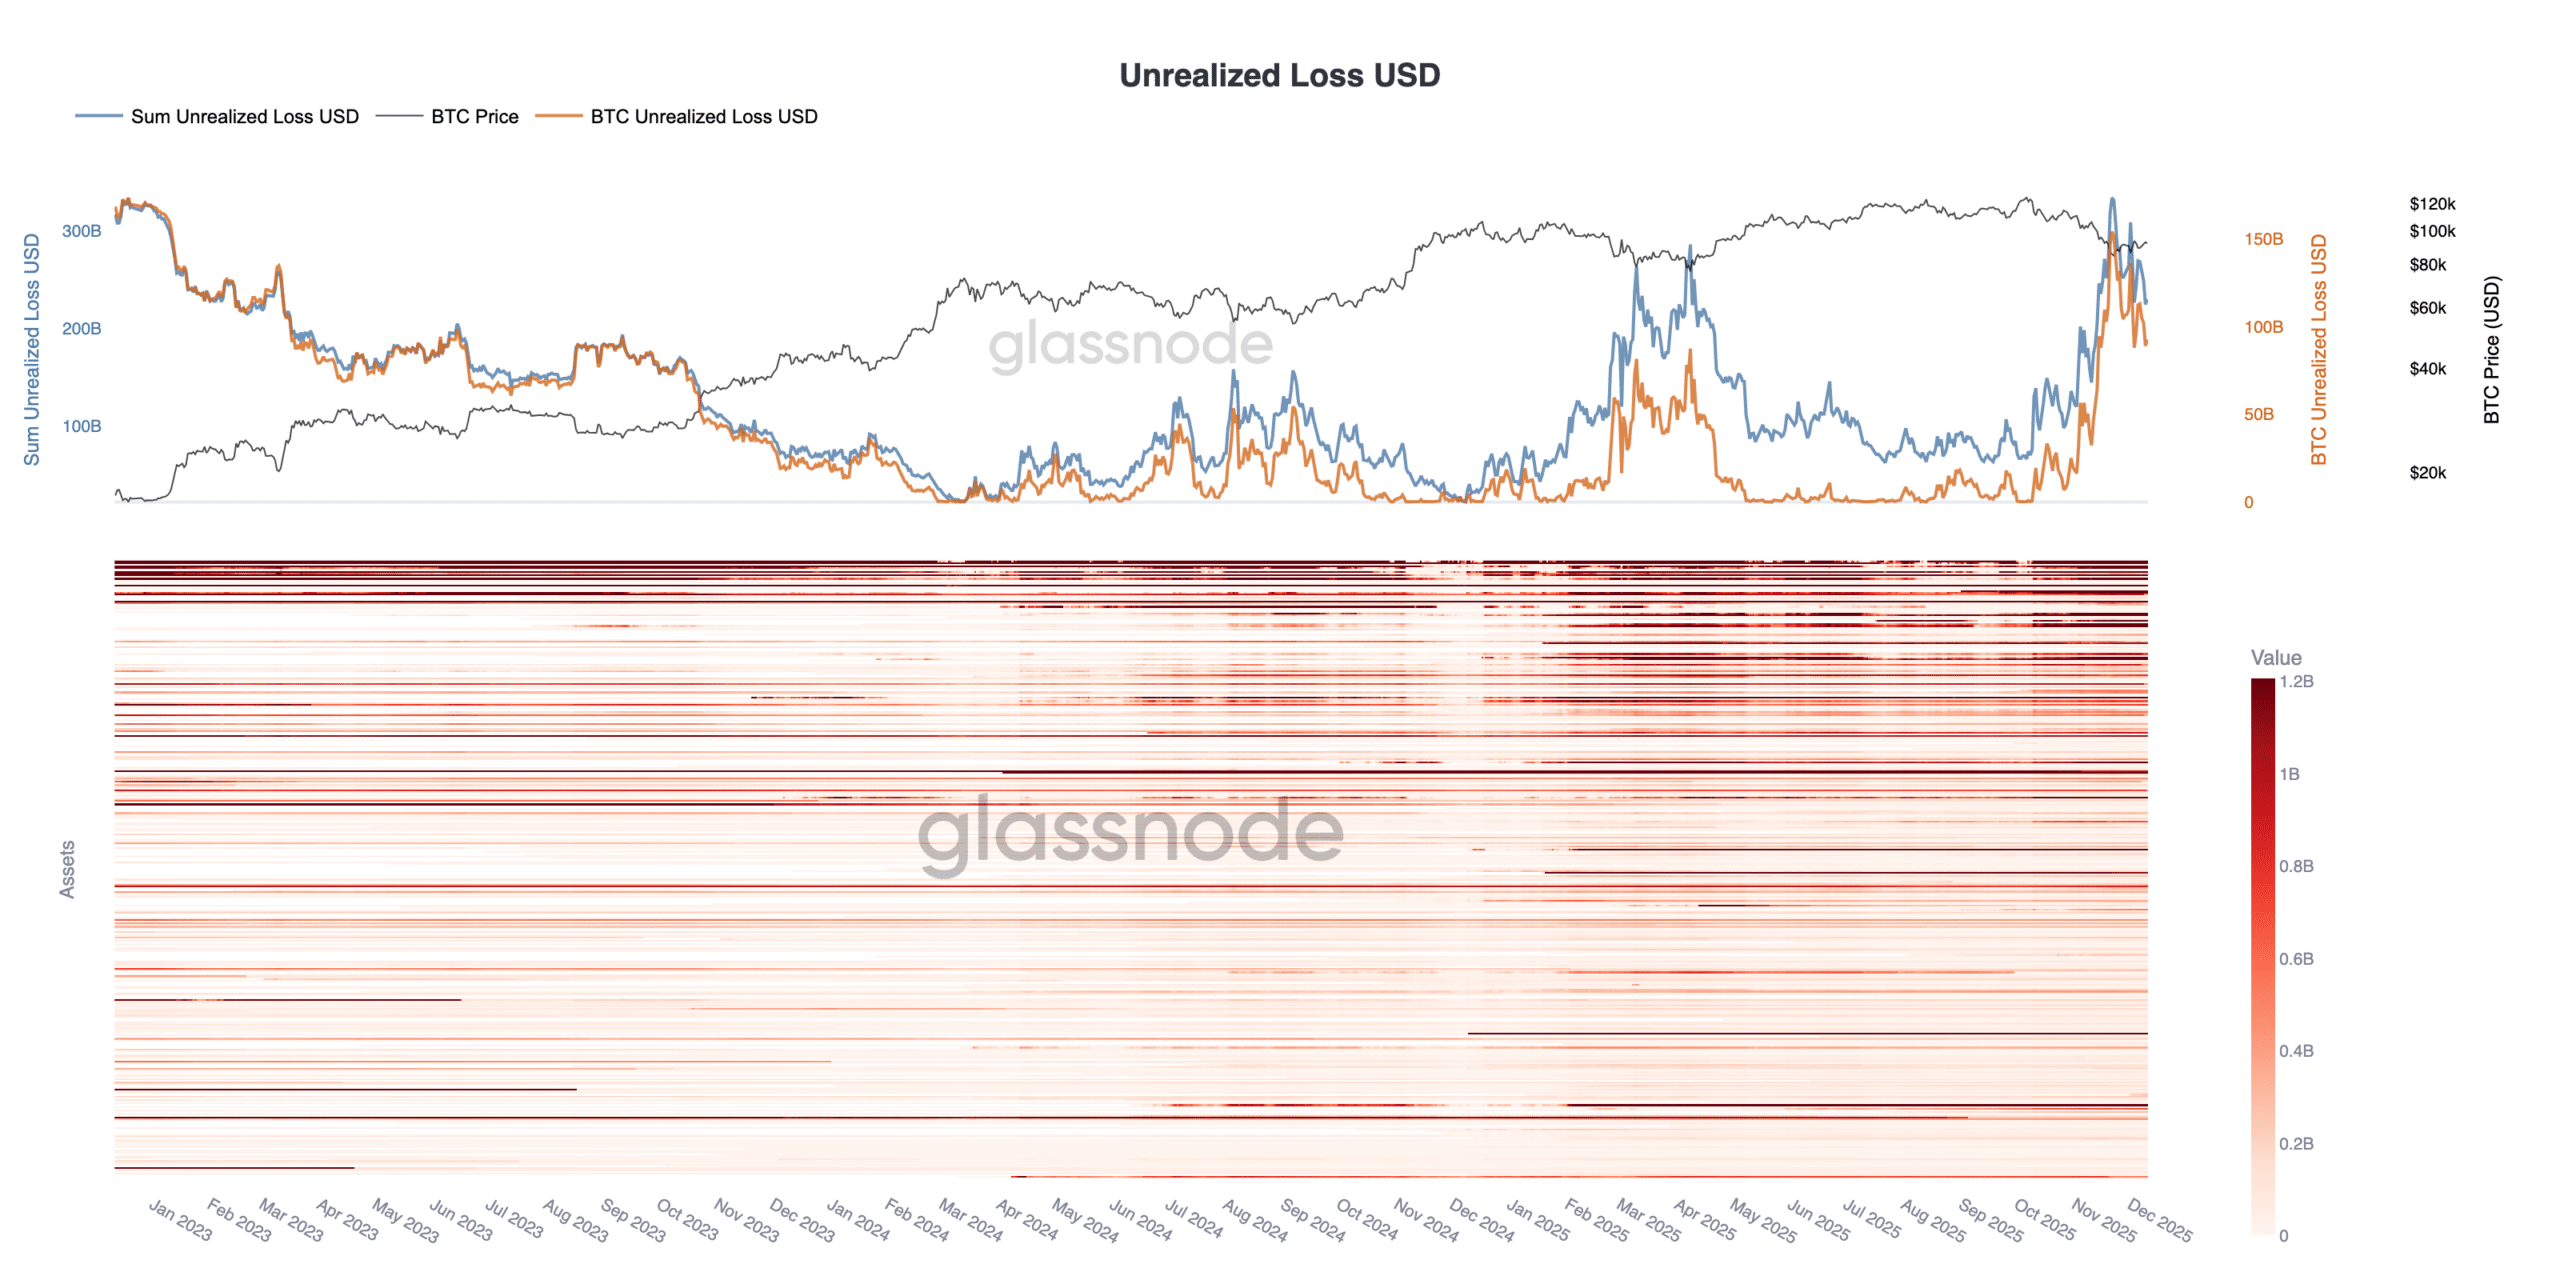
Source: Glassnode
For Bitcoin specifically, the chart shows:
- Losses have risen sharply as BTC pulled back from the $120k region
- BTC’s segment of unrealized losses [$85B] is heavy for an asset with deep liquidity
- Losses are concentrated in cohorts who accumulated late in the rally, especially near the cycle top
Historically, sharp increases in unrealized losses tend to coincide with either:
- Capitulation risk, when weak hands are forced out, or
- Volatility expansions, as compressed liquidity amplifies price reactions.
Glassnode notes that liquidity across the board is thinning — a combination of lower stablecoin flows, reduced market-maker depth, and declining spot volumes on major exchanges.
But the unrealized-profit chart shows the bigger structural context
When viewed alongside the unrealized-profit dataset, a different layer of market structure emerges.
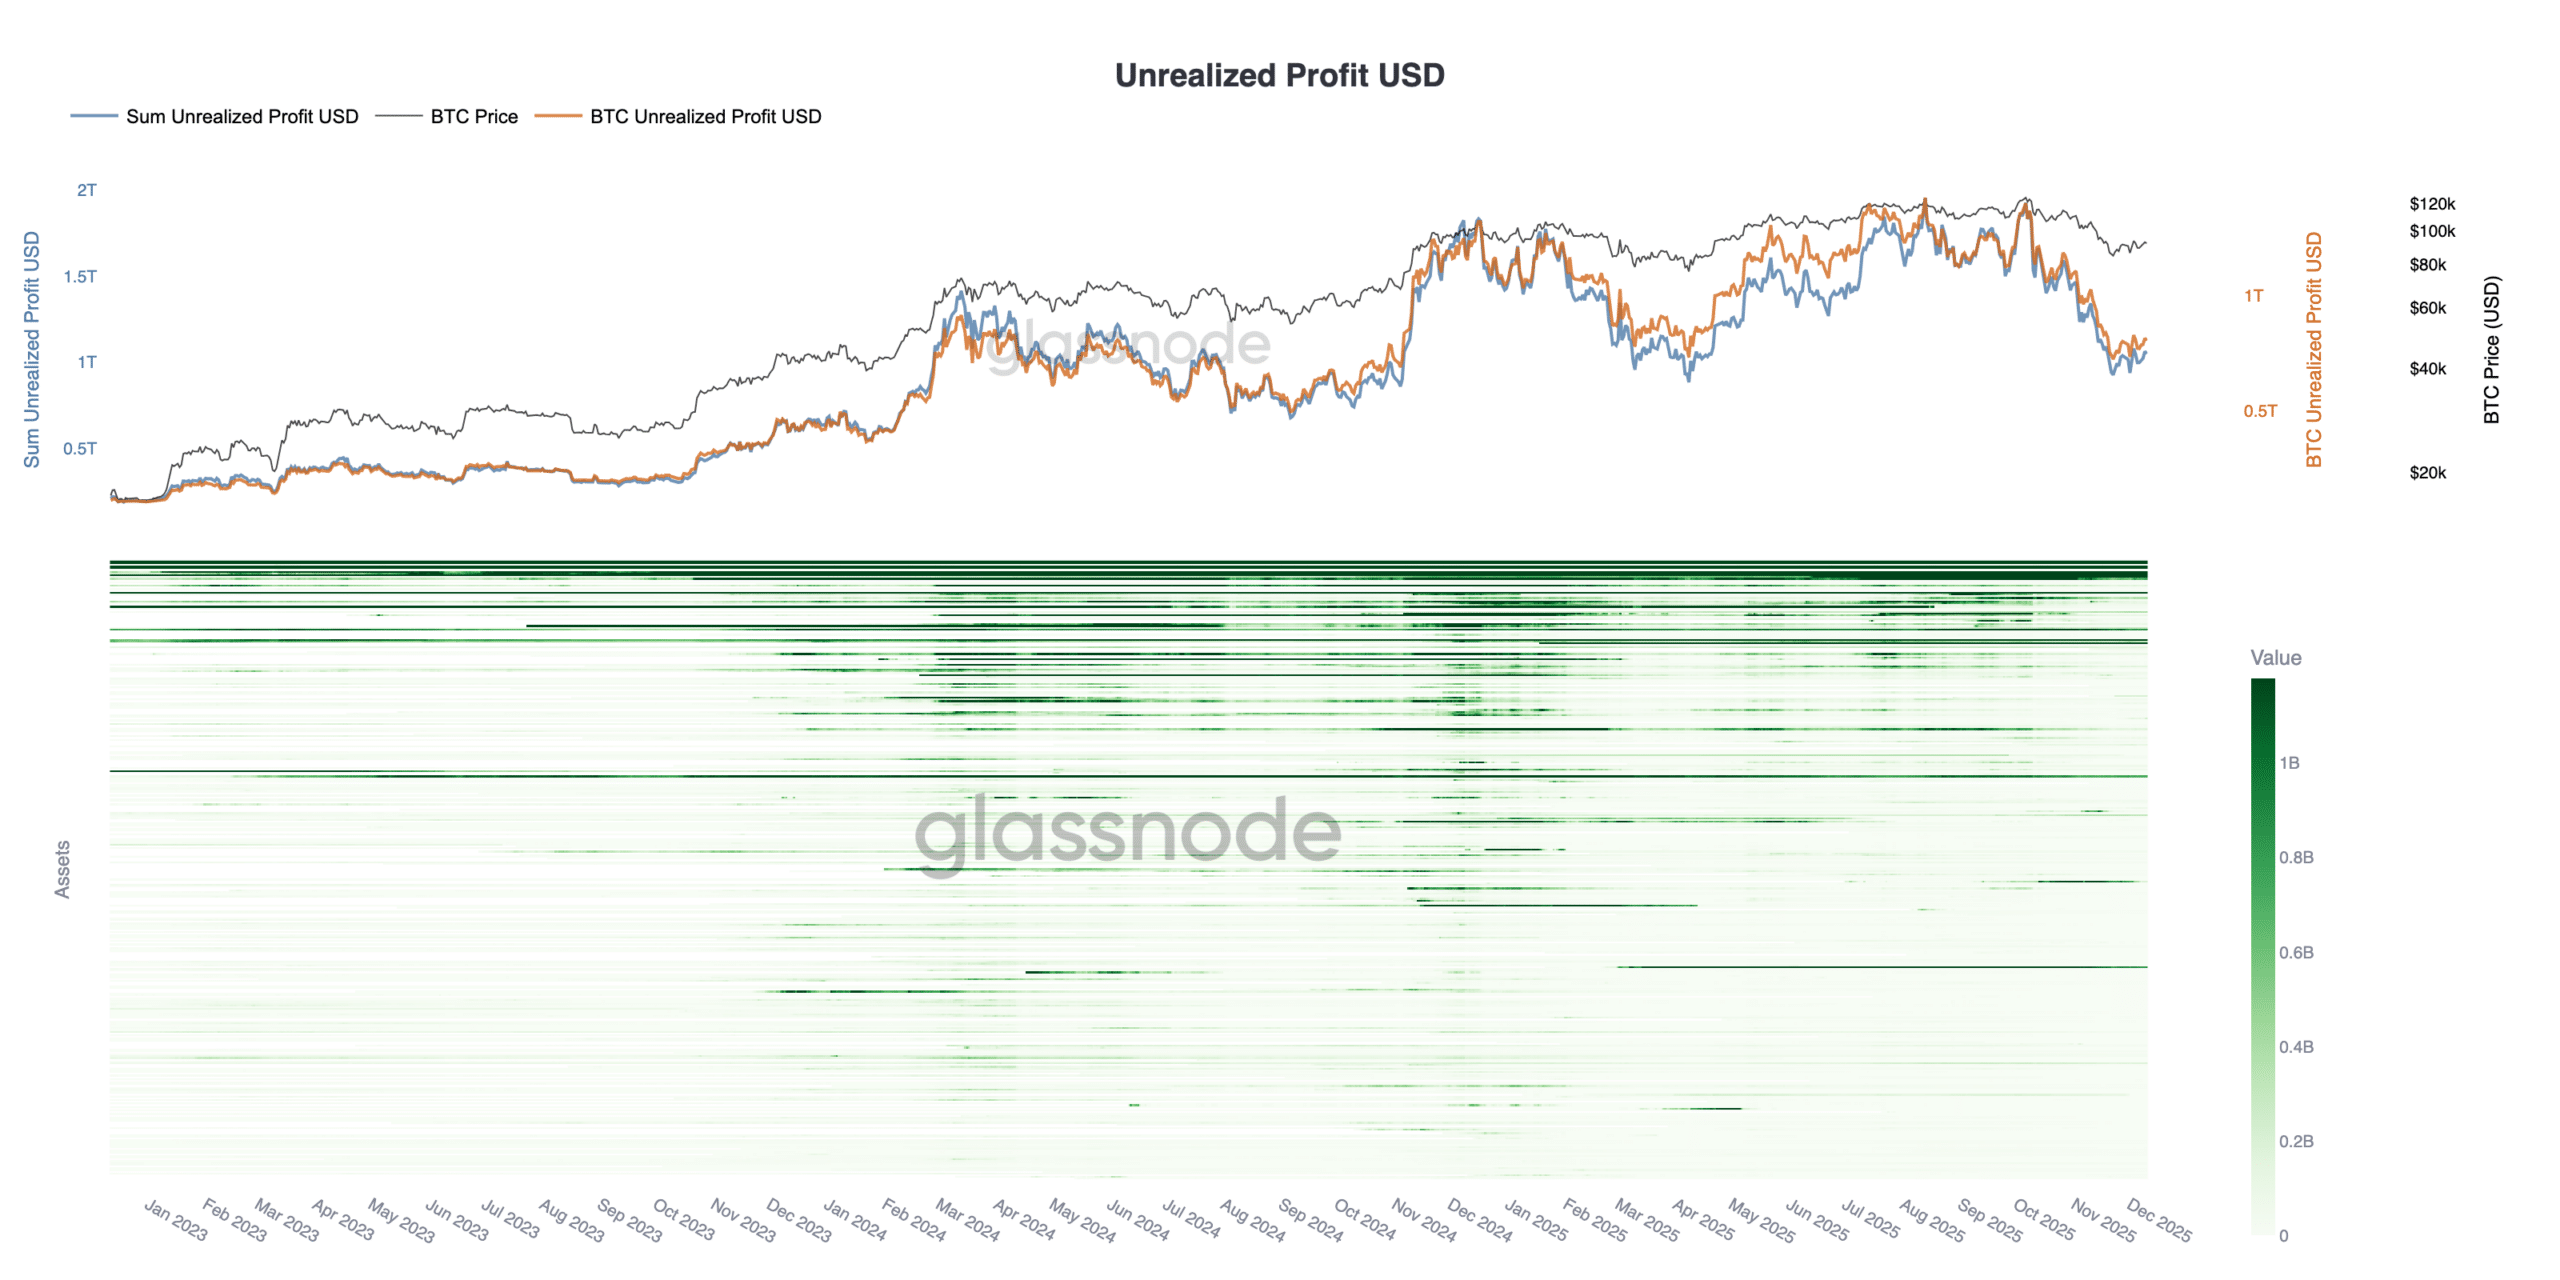
Source: Glassnode
Across the ecosystem:
- Unrealized profits remain historically large, still in the hundreds of billions
- Most long-term holders continue to sit on substantial gains
- Profit levels retraced from 2025’s peak but remain well above early-cycle norms
For Bitcoin, unrealized profits are still vastly greater than unrealized losses when zoomed out to the two-year window. This means:
- The market is not in a broad net-loss environment
- Long-term holders remain significantly in the green
- The increasing unrealized losses are driven primarily by newer entrants and high-price buyers, rather than a systemic break in holder profitability
This divergence — surging losses but still-large profits — is typical in late-stage bull-cycle corrections or mid-cycle consolidations.
What this tells us about the real state of the crypto market
Putting both charts together:
1. The market is stressed, but not structurally broken
Rising losses reflect short-term pain and thinning liquidity, but long-term profitability remains intact. Historically, markets only enter deep structural distress when unrealized losses outweigh profits — which is not the case today. Glassnode’s on-chain insights reinforce that the ecosystem’s foundation holds firm despite surface-level pressures.
2. Liquidity contraction is the main risk, not investor insolvency
The key problem is falling liquidity, not large-scale underwater holders. With liquidity drying up, even moderate buy/sell pressure can create outsized volatility. Data from major exchanges shows spot volumes down 20-30% from summer highs, per Glassnode reports, heightening sensitivity to flows.
3. Volatility is likely to expand in the coming weeks
As Glassnode highlighted, the combination of rising losses + shrinking liquidity has preceded major volatility expansions in previous cycles. Traders may see intraday swings widen by 50% or more, based on patterns from 2022 and 2024 corrections.
4. A capitulation event is possible — but not guaranteed
Current conditions resemble previous setups where:
- Late buyers capitulated
- Strong hands accumulated
- Markets later recovered as liquidity returned
However, if macro tightening resumes or crypto-specific shocks emerge, the losses could deepen before stabilizing. On-chain metrics like exchange inflows will be critical to watch for early signs.
Frequently Asked Questions
What causes crypto unrealized losses to rise during bull markets?
Crypto unrealized losses typically rise when prices correct from peaks, hitting late entrants who bought at highs. In the current cycle, Bitcoin’s pullback from $120,000 has pushed total losses to $350 billion, concentrated in short-term holders, as tracked by Glassnode. This reflects tactical overextension rather than market failure.
How can investors track unrealized profits and losses in real time?
Investors can monitor unrealized profits and losses using on-chain analytics platforms like Glassnode, which provide heatmaps and cohort breakdowns for assets like Bitcoin. These tools show wallet-level data, helping gauge sentiment—profits stay elevated for veterans while losses mount for newcomers, guiding positioning amid volatility.
Key Takeaways
- Unrealized losses surge to $350 billion: Driven by Bitcoin’s $85 billion share, this signals short-term stress from recent corrections.
- Profits remain robust in hundreds of billions: Long-term holders’ gains buffer the market, preventing net insolvency per Glassnode data.
- Liquidity thinning boosts volatility risk: Prepare for expanded swings into 2026; monitor flows for capitulation cues.
Conclusion
In summary, crypto unrealized losses at $350 billion underscore mounting market stress, particularly for Bitcoin with its $85 billion portion, yet unrealized profits in the hundreds of billions maintain structural integrity for seasoned investors. As liquidity contracts, volatility may intensify through early 2026, but historical patterns suggest recovery potential once conditions stabilize. Stay vigilant with on-chain tools like those from Glassnode to navigate this phase effectively.
Related Tags
Comments
Other Articles
LTC MWEB Vulnerability: 13 Block Reorg and Market Impact
April 28, 2026 at 05:32 AM UTC
Oil Prices Surge 3% After Trump Cancels Iran Meetings and Promises Protesters ‘Help Is on the Way’ – What It Means for Bitcoin
January 13, 2026 at 05:49 PM UTC
Bitcoin Surges to $93,888: How Venezuela-US Tensions Triggered a Crypto Rally
January 5, 2026 at 07:04 AM UTC