Ethereum can initiate its rise from this critical support! August 17th ETH Analysis
ETH/USDT
$6,206,664,490.61
$2,046.60 / $1,979.99
Change: $66.61 (3.36%)
-0.0003%
Shorts pay

Contents
- Ethereum received a strong buying response from the $1778 support and started an uptrend with closings above $1772.
- If the price closes above the $1880 level, the $1910 resistance can be targeted.
- However, 4-hour candle closings below $1772 can trigger a decline, and the $1740 support is considered an important area.
Ethereum has started to rise with buying response at the $1778 level. Daily closings above $1772 can strengthen the $1880 target, while closings below $1772 can support the downward trend.
Medium-Term ETH Analysis
When the 12-hour technical chart of Ethereum is examined, it is observed that candle closings below the $1815 level have brought the price down to around $1780. As long as ETH continues to close below the mentioned $1815 level on a daily basis, it can expand the downward movement towards the support range of $1778 – $1749.
However, if ETH receives strong buying responses in the $1778 – $1749 support range, it can rise from this support zone towards the $1880 level first and then towards the $2023 level. However, if ETH closes below the $1749 support on a daily basis, there is a possibility of continuing the downward trend.
If the ETH price achieves daily candle closings below the $1749 level, it can continue its downward movement towards the next critical support level of $1720. If closings below $1720 occur, the next target could be $1690. However, if ETH closes above $1880 on a daily basis, it can eliminate the possibilities of a decline.
Short-Term ETH Analysis
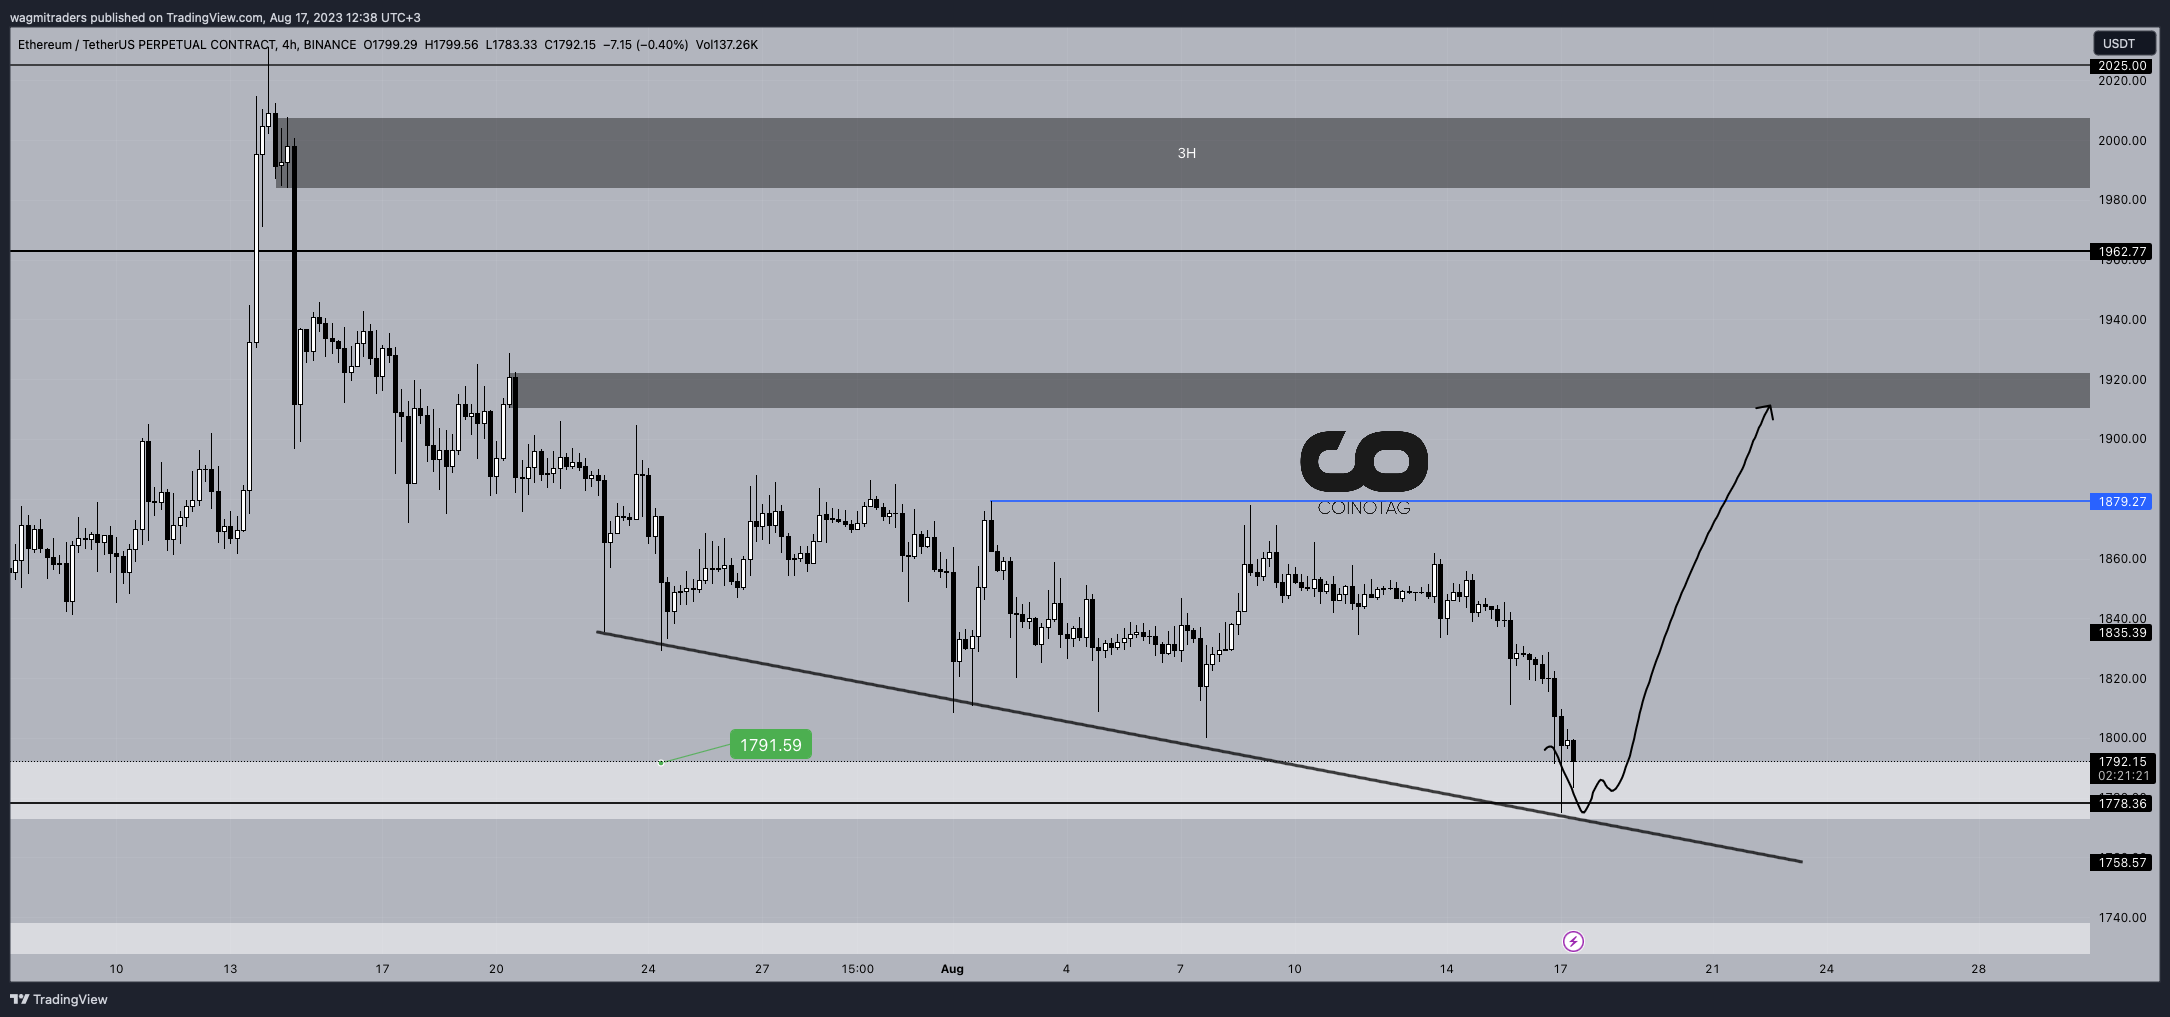
When the 4-hour technical chart of Ethereum is examined, it is observed that it received a strong buying response from the $1778 support. As long as ETH achieves daily closings above the $1772 level, it can initiate the upward movement from these levels and target the $1880 level again.
If ETH achieves daily closings above $1880, it may carry the upward movement towards the next critical resistance level of $1910. However, if Ethereum makes 4-hour candle closings below $1772, there is a possibility of expanding the downward trend towards the $1740 support.
If Ethereum receives a strong buying response from the $1740 level, it carries the potential to reverse the trend. However, as mentioned in the analysis, it should be noted that ETH needs to stay above the $1772 support.