Ethereum Investors Should Follow This Level for Upside Potential!
ETH/USDT
$39,049,302,904.94
$2,145.26 / $2,009.54
Change: $135.72 (6.75%)
-0.0018%
Shorts pay

Contents
- Ethereum’s $1779 level is seen as an important support zone and candle closures above it continue.
- Ethereum making daily candle closures above the $1829 level can initiate the uptrend and increase its targets.
- If Ethereum fails to break the $1829 resistance, the downtrend may continue.
When examining Ethereum’s short-term price chart, it is observed that the $1779 level is a strong support and movement above it continues. It is predicted that Ethereum can accelerate its upward movement and move towards new targets with the overcoming of the $1829 resistance mentioned in the analysis.
Medium-Term ETH Price Analysis!
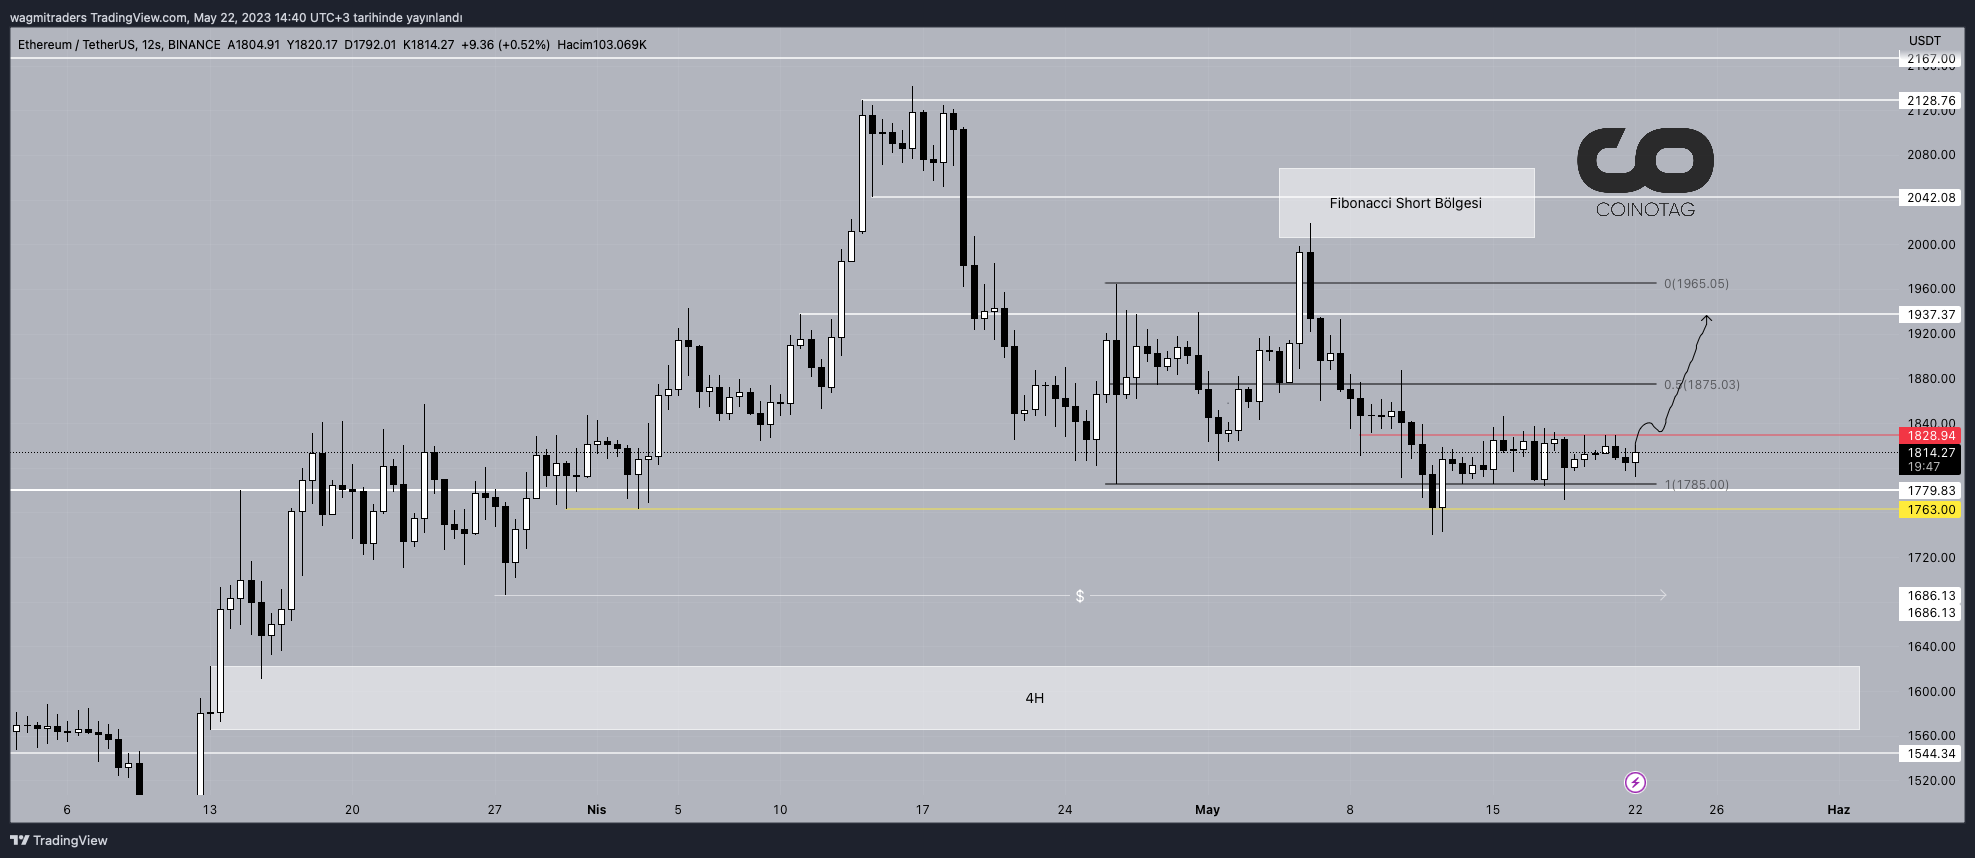
12 Hour ETH Price Chart Source: TradingView
When examining Ethereum’s 12-hour price chart, it is seen that the $1779 level is an important support zone and Ethereum continues to make candle closures above this level.
It is thought that Ethereum can aim to test the $1828 resistance level as long as it stays above the $1779 support mentioned in the analysis.
However, for Ethereum to initiate the uptrend, it needs to make daily candle closures above the $1829 level.
Ethereum can target the $1875 level as the first target if it manages to break the $1829 resistance. If Ethereum also surpasses the $1875 resistance, it can continue the next uptrend movement up to $1937 levels.
However, if Ethereum fails to break the $1829 resistance, there is a possibility of continuing the downtrend. Therefore, it is important to closely monitor this resistance zone.
Short-Term ETH Price Analysis
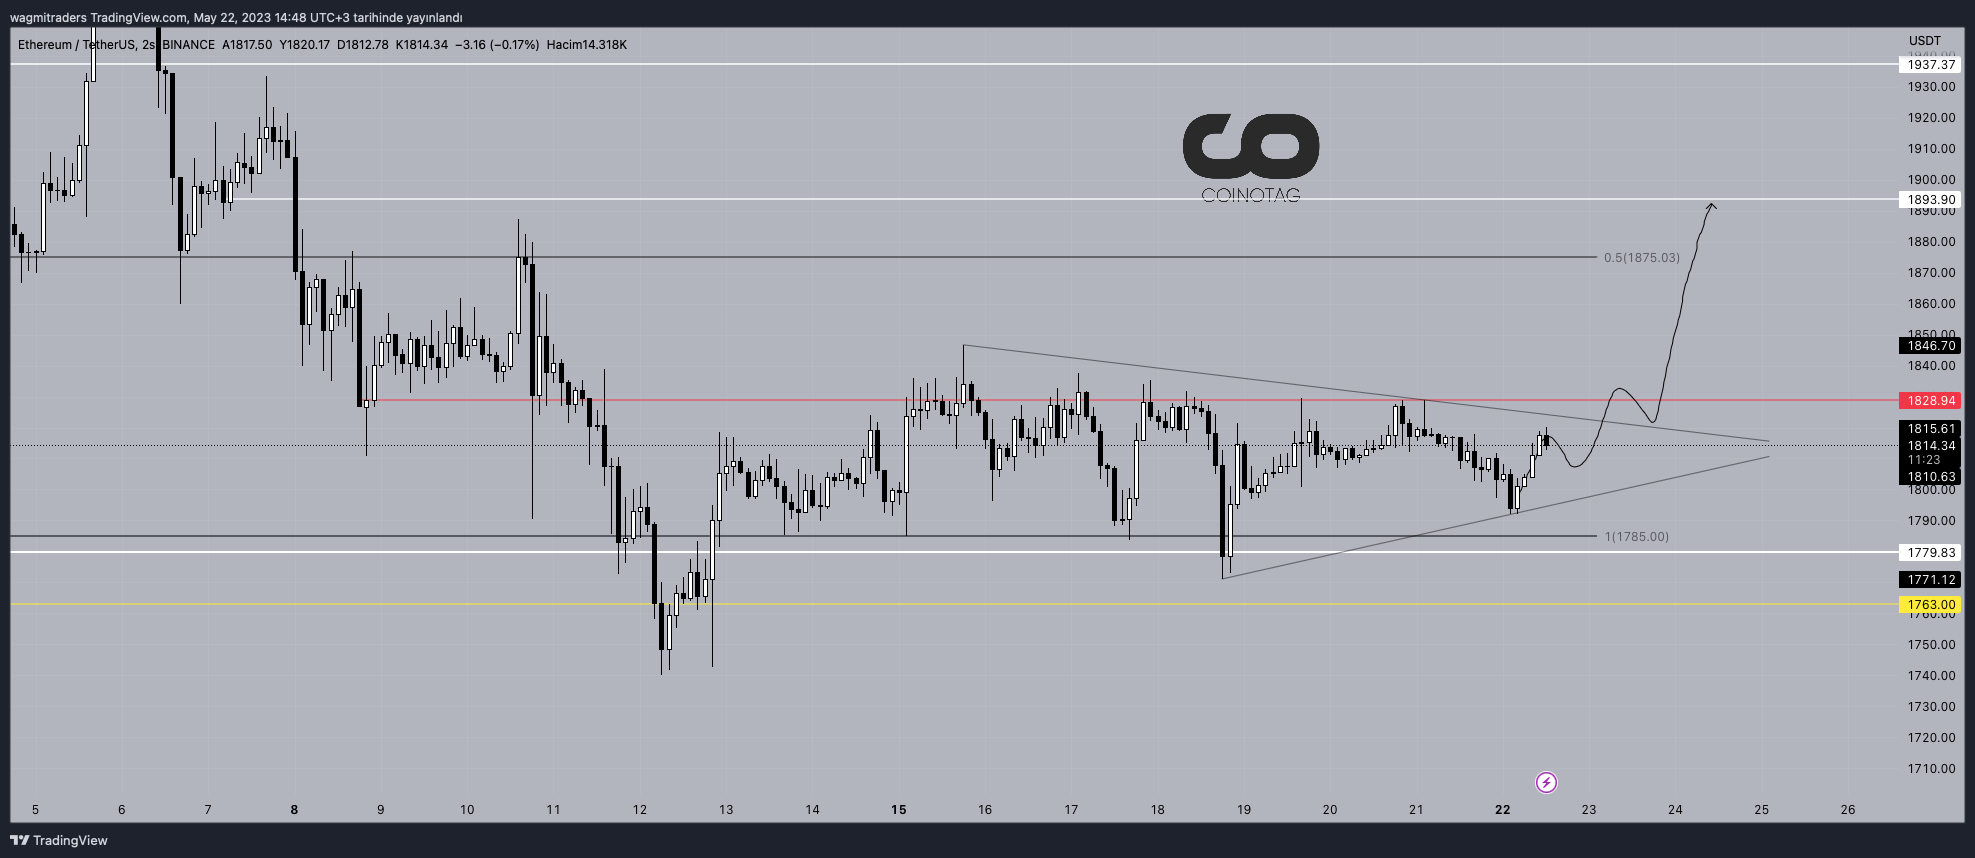
2 Hour ETH Price Chart Source: TradingView
When examining Ethereum’s short-term price chart, it is seen that it continues its horizontal movements within the triangle formation.
It is predicted that if the triangle formation mentioned in the analysis is broken upwards and this break is confirmed with candle closure, Ethereum can continue its upward movement towards $1893 levels.
However, if Ethereum performs a downward break of the triangle formation, a downward movement towards $1773 levels may be observed.
In light of this information, it is important to monitor in which direction Ethereum will break the triangle formation.