PEPE Remains Bearish But May Eye 12-15% Bounce to Key Liquidation Zones

Contents
PEPE continues its strong downtrend in 2025, with no immediate reversal in sight on higher timeframes, though a short-term bounce of 12-15% toward key resistance levels around $0.00000524 could occur due to oversold conditions and potential short squeezes.
-
PEPE’s bearish structure persists since late September 2025, driven by moving average crossovers and selling pressure indicators.
-
The memecoin sector, including PEPE and Dogecoin, has seen significant declines, with DOGE down 50% this year.
-
Liquidation heatmaps from CoinGlass show clustered short positions at $0.000005-$0.0000055, increasing chances for a liquidity hunt rally.
Discover PEPE’s current downtrend analysis and potential short-term bounce in 2025. Explore key indicators and liquidation levels for informed trading decisions. Stay updated on memecoin trends today.
What is the outlook for PEPE’s downtrend in 2025?
PEPE’s downtrend remains firmly in place on higher timeframes, showing no signs of reversal as of late 2025. The token has underperformed among top memecoins, with its price structure forming lower highs since September, exacerbated by bearish moving average alignments and sector-wide pressures. While oversold signals hint at a temporary relief rally, the overall bearish dominance suggests limited upside potential without broader market shifts.
How might a short-term PEPE price bounce develop?
Technical indicators point to a possible minor rebound for PEPE amid its ongoing decline. On the daily chart, the Stochastic RSI has recently formed a bullish crossover, indicating potential oversold conditions that could trigger buying interest. According to data from TradingView, this pattern previously led to a 12% rally on November 6, 2025, before the price resumed its downward trajectory. The Chaikin Money Flow (CMF) has also recovered to neutral levels at -0.04, suggesting easing selling pressure. Such dynamics, combined with high short leverage, could propel PEPE toward resistance zones, but experts caution that this would likely serve as a selling opportunity rather than a trend changer. As noted by on-chain analysts, memecoins like PEPE often experience volatility driven by liquidity events, with historical data showing 70% of similar crossovers resulting in short-lived bounces under 15% in bear markets.
Pepe [PEPE] has been the worst-performing memecoin among the top 5 in the sector. The meme sector’s woes were not confined to PEPE alone though, as even Dogecoin [DOGE] recorded a 50% decline in 2025.
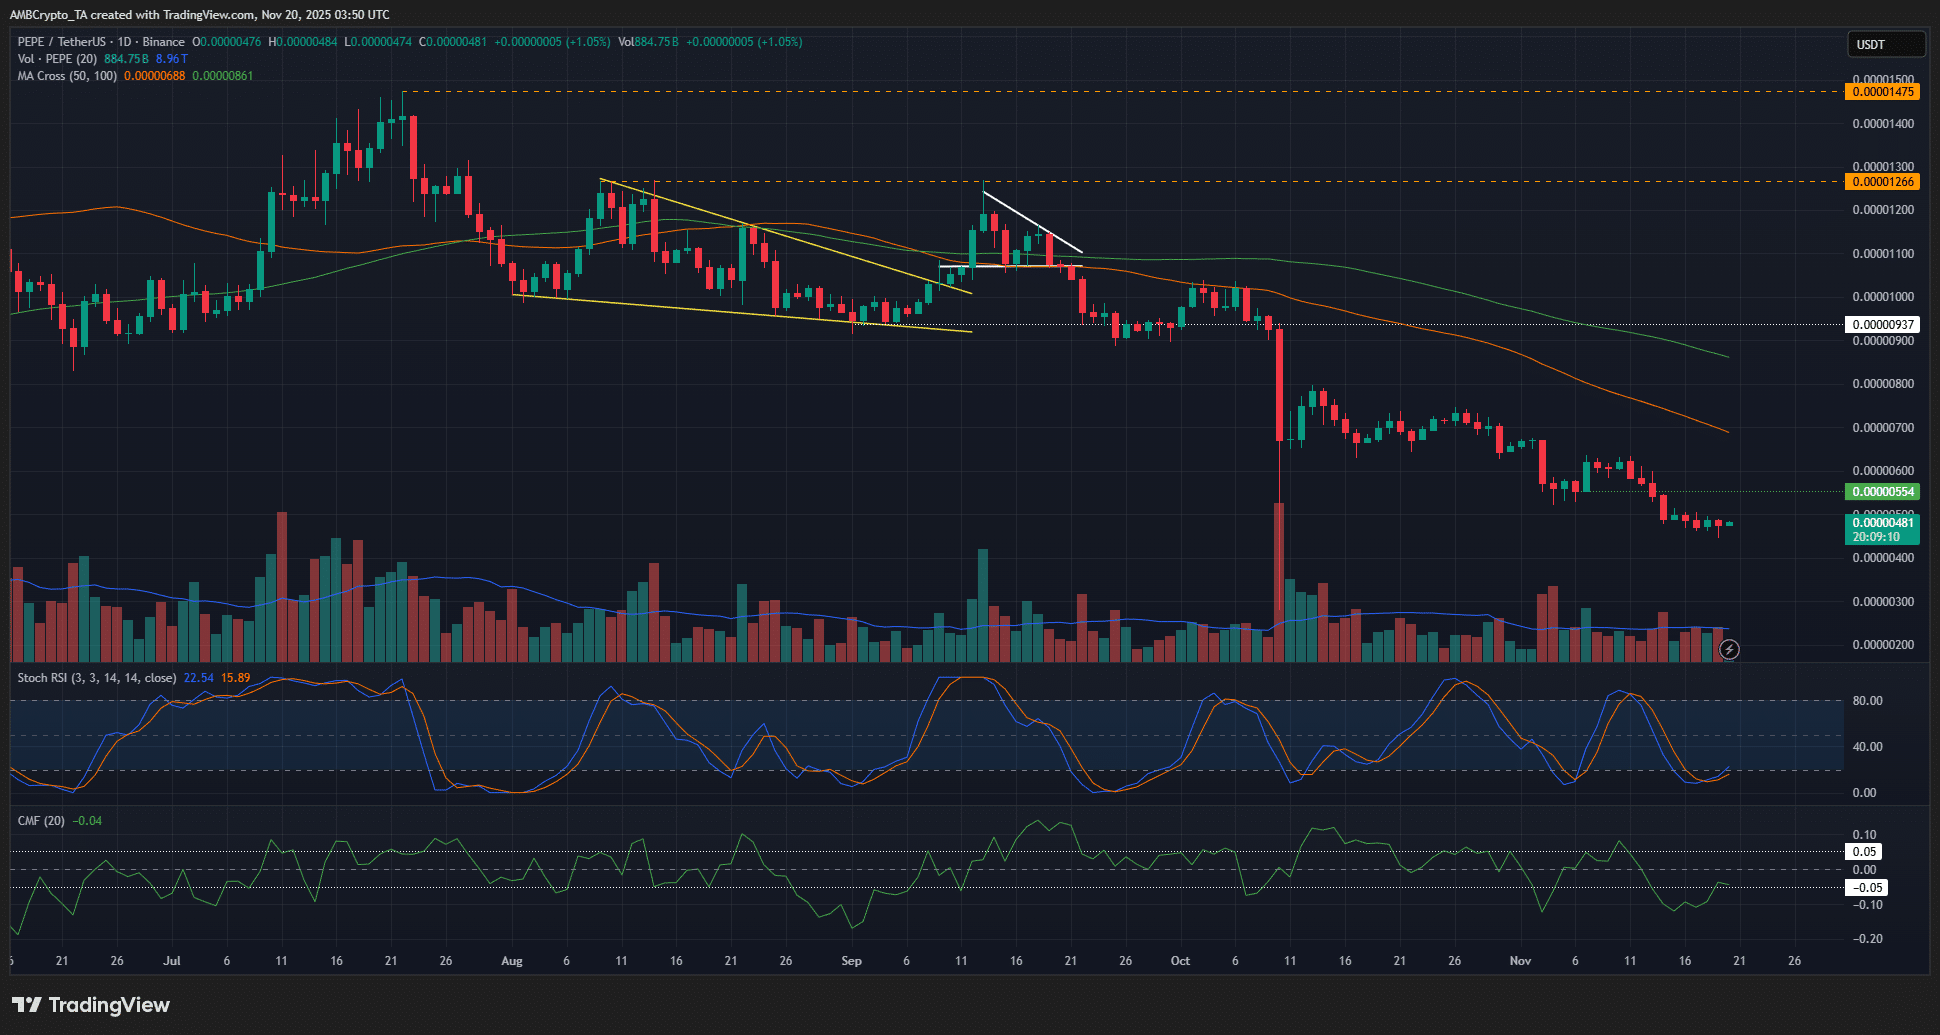
Source: PEPE/USDT on TradingView
On the 1-day chart, PEPE has remained firmly bearish. The structure, and hence the trend, on this timeframe has been bearish since late September, when the memecoin made a new lower high below $0.00000937.
The moving averages formed a bearish crossover earlier in September, and have stayed steadily bearish in the months since. The CMF also highlighted strong selling pressure recently, but it climbed back into neutral territory. It showed a reading of -0.04 at press time.
The Stochastic RSI formed a bullish crossover. This could lead to a minor price bounce, as the market may be likely overextended to the downside.
On 06 November, a bullish Stochastic RSI crossover was followed by a 12% price rally before PEPE slumped again. It is possible that a similar scenario would unfold once again. In that case, a bounce as high as $0.00000524 can be expected.
Such a bounce would most likely present a selling opportunity, given the trend and overall bearish dominance across the sector.
Frequently Asked Questions
Does PEPE stand a chance to reverse its strong downtrend in 2025?
The memecoin sector, including PEPE, remains bearish on higher timeframes with no clear reversal signals. While short-term bounces are possible due to technical oversold conditions, the prevailing trend structure and sector declines indicate sustained downward pressure without fundamental catalysts.
How high could a potential PEPE price bounce reach based on current indicators?
Current liquidation data suggests a bounce of 12-15% toward $0.00000524, where key resistance and short positions cluster. This level aligns with historical rally patterns following Stochastic RSI crossovers, offering a natural pause before potential resumption of the downtrend, ideal for voice search queries on memecoin volatility.
There is a chance of a PEPE short-squeeze!
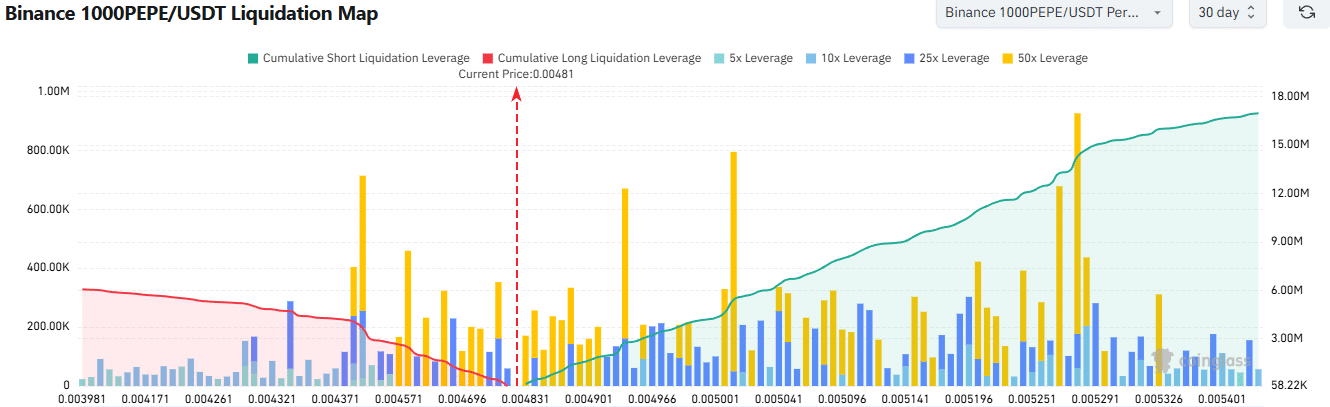
Source: CoinGlass
As noted earlier, the prevailing downtrend meant many market participants would be betting on the trend to continue. This meant that short liquidation levels have built up to noticeable levels.
The attached chart highlighted how the cumulative short liquidation leverage was much higher than the long leverage. Combined with the Stochastic crossover and a price bounce, a brief PEPE rally to hunt this liquidity may be likely.
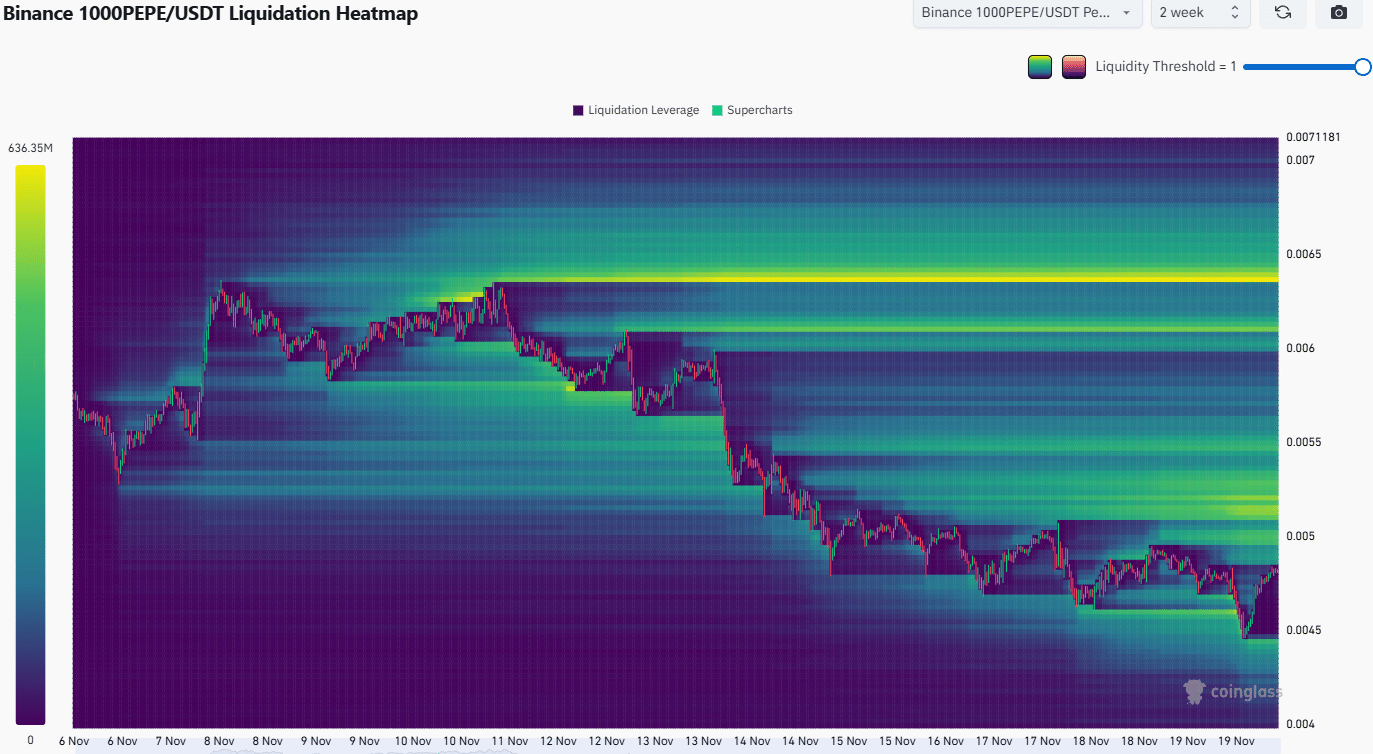
Source: CoinGlass
The liquidation heatmap revealed that the $0.000005-$0.0000055 area was thick with liquidations. This made it the most likely candidate for a bounce. Beyond that, the $0.000006-$0.0000066 area could also be a strong magnetic zone.
Hence, PEPE bears can wait for this bounce to play out before going short or selling.
Key Takeaways
- PEPE’s bearish trend intact: Higher timeframes show no reversal, with structure locked in since September 2025, supported by moving average bearish crossovers.
- Potential short-term bounce: Stochastic RSI crossover and neutral CMF suggest 12-15% upside to $0.00000524, mirroring November’s rally pattern.
- Short-squeeze opportunity: Elevated short liquidations at key levels could drive liquidity hunts, but view as sell signal in dominant bearish sector.
Conclusion
In summary, PEPE’s downtrend in 2025 persists amid broader memecoin challenges, with technical indicators like the Stochastic RSI offering hints of a brief PEPE price bounce toward liquidation-heavy zones. While a short-squeeze scenario adds intrigue, the overall bearish structure advises caution for traders. Monitor sector developments closely, and consider professional advice before engaging with volatile assets like PEPE for potential opportunities ahead.
Disclaimer: The information presented does not constitute financial, investment, trading, or other types of advice and is solely the writer’s opinion.
Add COINOTAG as a Preferred Source
Add COINOTAG to your preferred sources in Google News and Search to see our coverage first.
Add on GoogleRelated Tags
Comments
Other Articles
Bitcoin slips to $79,000, DOGE leads majors losses as negative funding rates set 10-year record
May 8, 2026 at 05:00 AM UTC
Crypto ETF boom continues with debut of first fund to track Canton
May 7, 2026 at 03:02 PM UTC
Bitcoin stalls below $83K while altcoins flash bullish rotation: Crypto Markets Today
May 7, 2026 at 10:26 AM UTC