Solana May Face Further Losses as Whale Sells 100K Tokens
SOL/USDT
$5,224,756,324.54
$97.68 / $91.27
Change: $6.41 (7.02%)
+0.0007%
Longs pay

Contents
Solana (SOL) has been trading in a tight range of $130 to $140 after rejection at $146, driven by increased whale selling pressure. A major whale recently deposited 100,000 SOL worth $13.57 million to Binance, signaling bearish sentiment amid positive spot netflows indicating outflows.
-
Solana whale activity surges: Large orders noted since late November, with one whale offloading 100,000 SOL to exchanges.
-
Price stagnation persists: SOL holds at $133, down nearly 2% daily, as bearish momentum strengthens.
-
Technical indicators warn of losses: Directional Movement Index shows oversold conditions with -DI at 32, risking a drop below $130 support.
Solana whale sells 100k SOL amid price struggles: Discover how whale offloads and bearish signals could push SOL lower to $126. Stay informed on crypto market trends for smarter investing.
What is causing Solana’s current price stagnation?
Solana whale activity is a key factor in the cryptocurrency’s recent price stagnation, as large holders continue to offload tokens amid prolonged bearish conditions. Since facing rejection at $146 about a week ago, Solana has remained confined to a narrow trading band between $130 and $140, currently hovering around $133 with a daily decline of approximately 1.94%. This lack of upward momentum reflects growing investor caution, particularly from whales, who are reducing their positions to secure profits and mitigate potential losses.
How has whale selling impacted Solana’s market dynamics?
Whale activity on Solana’s spot market has intensified, with data from CryptoQuant revealing elevated average order sizes from large investors since November 28. These substantial orders indicate heightened participation by whales, which can influence market direction through either accumulation or distribution. In this case, on-chain monitoring by EmberCN highlighted a specific instance where a prominent whale transferred 100,000 SOL, valued at $13.57 million, to Binance for potential sale. This move is part of a broader pattern for this address, which began unlocking and distributing holdings in April, offloading a total of 615,000 SOL worth $107 million over eight months in incremental batches.
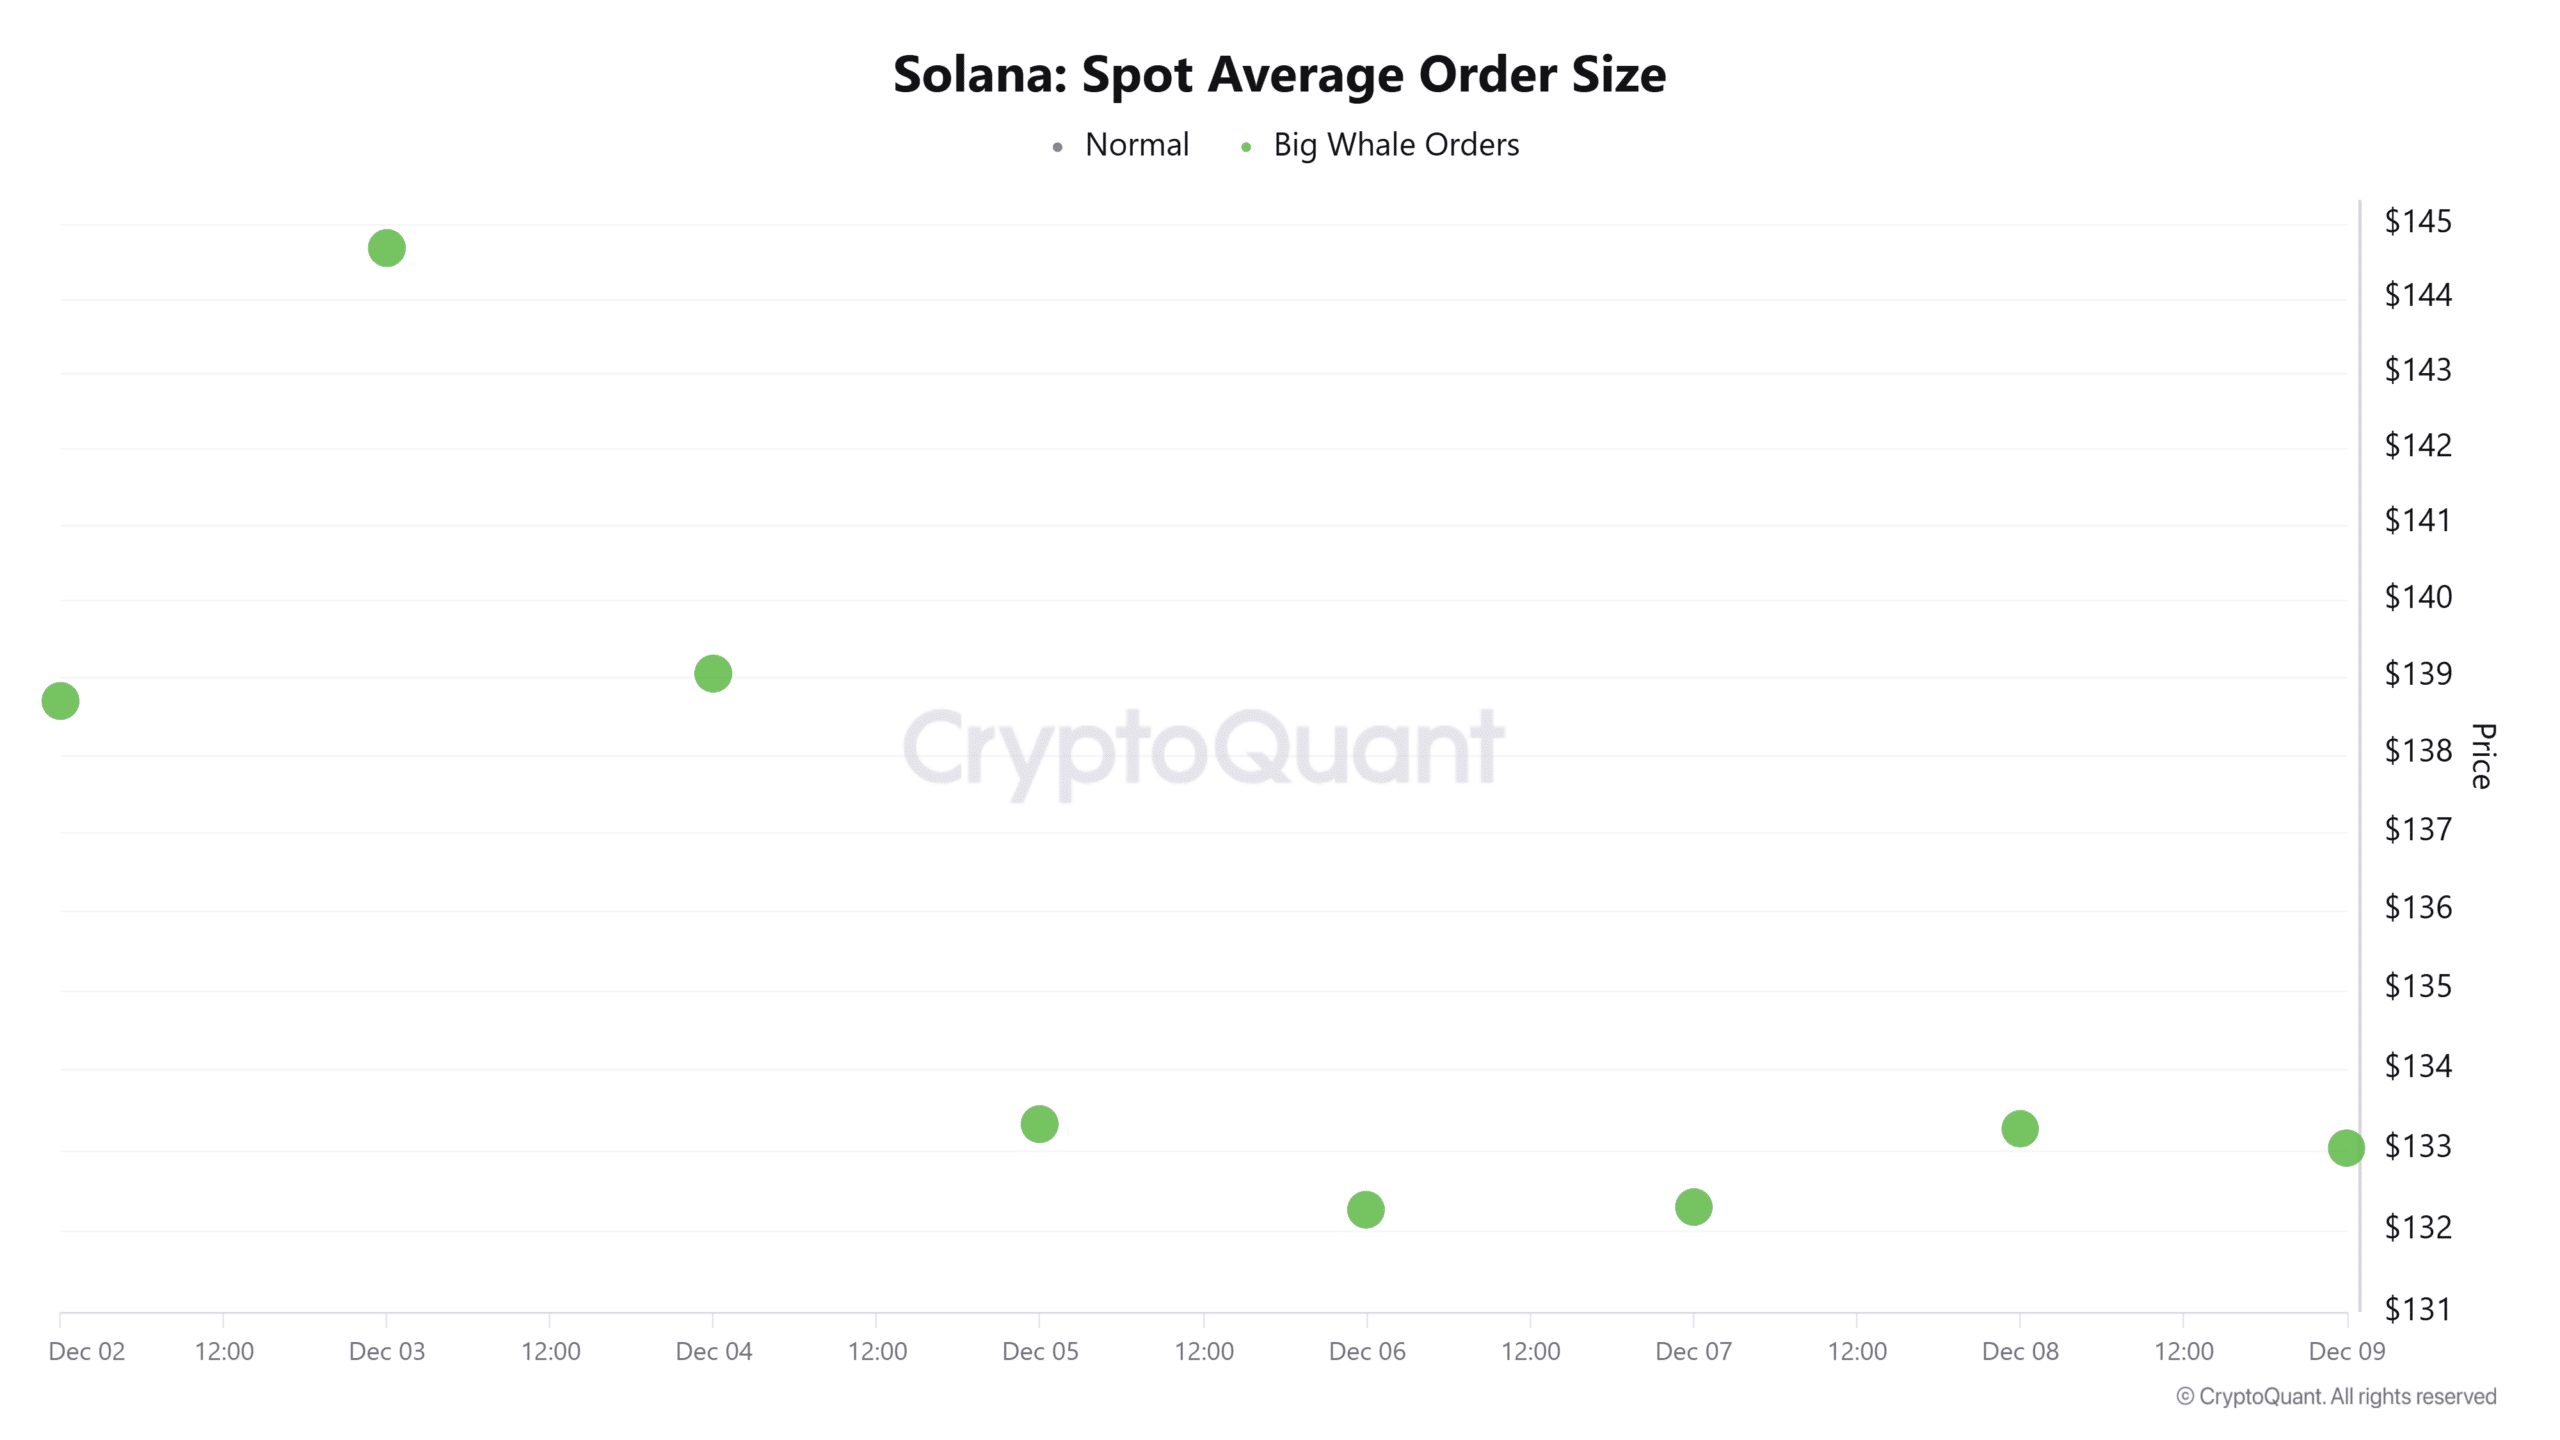
Source: CryptoQuant
Despite these sales, the whale retains a significant position of 733,000 SOL, approximately $99.16 million in value, bolstered by 357,000 SOL earned from staking rewards over the past four and a half years. Continuous offloading by such large holders often underscores a lack of confidence in short-term price recovery, prompting them to realize gains while avoiding downside risks. This behavior aligns with broader exchange metrics, where CoinGlass data shows Solana’s spot netflow shifting to positive territory after four days of negative flows, reaching $2.66 million at the time of reporting— a stark contrast to the prior day’s -$23.5 million. Positive netflow in this context points to net inflows to exchanges, which typically precede increased selling and downward price pressure.
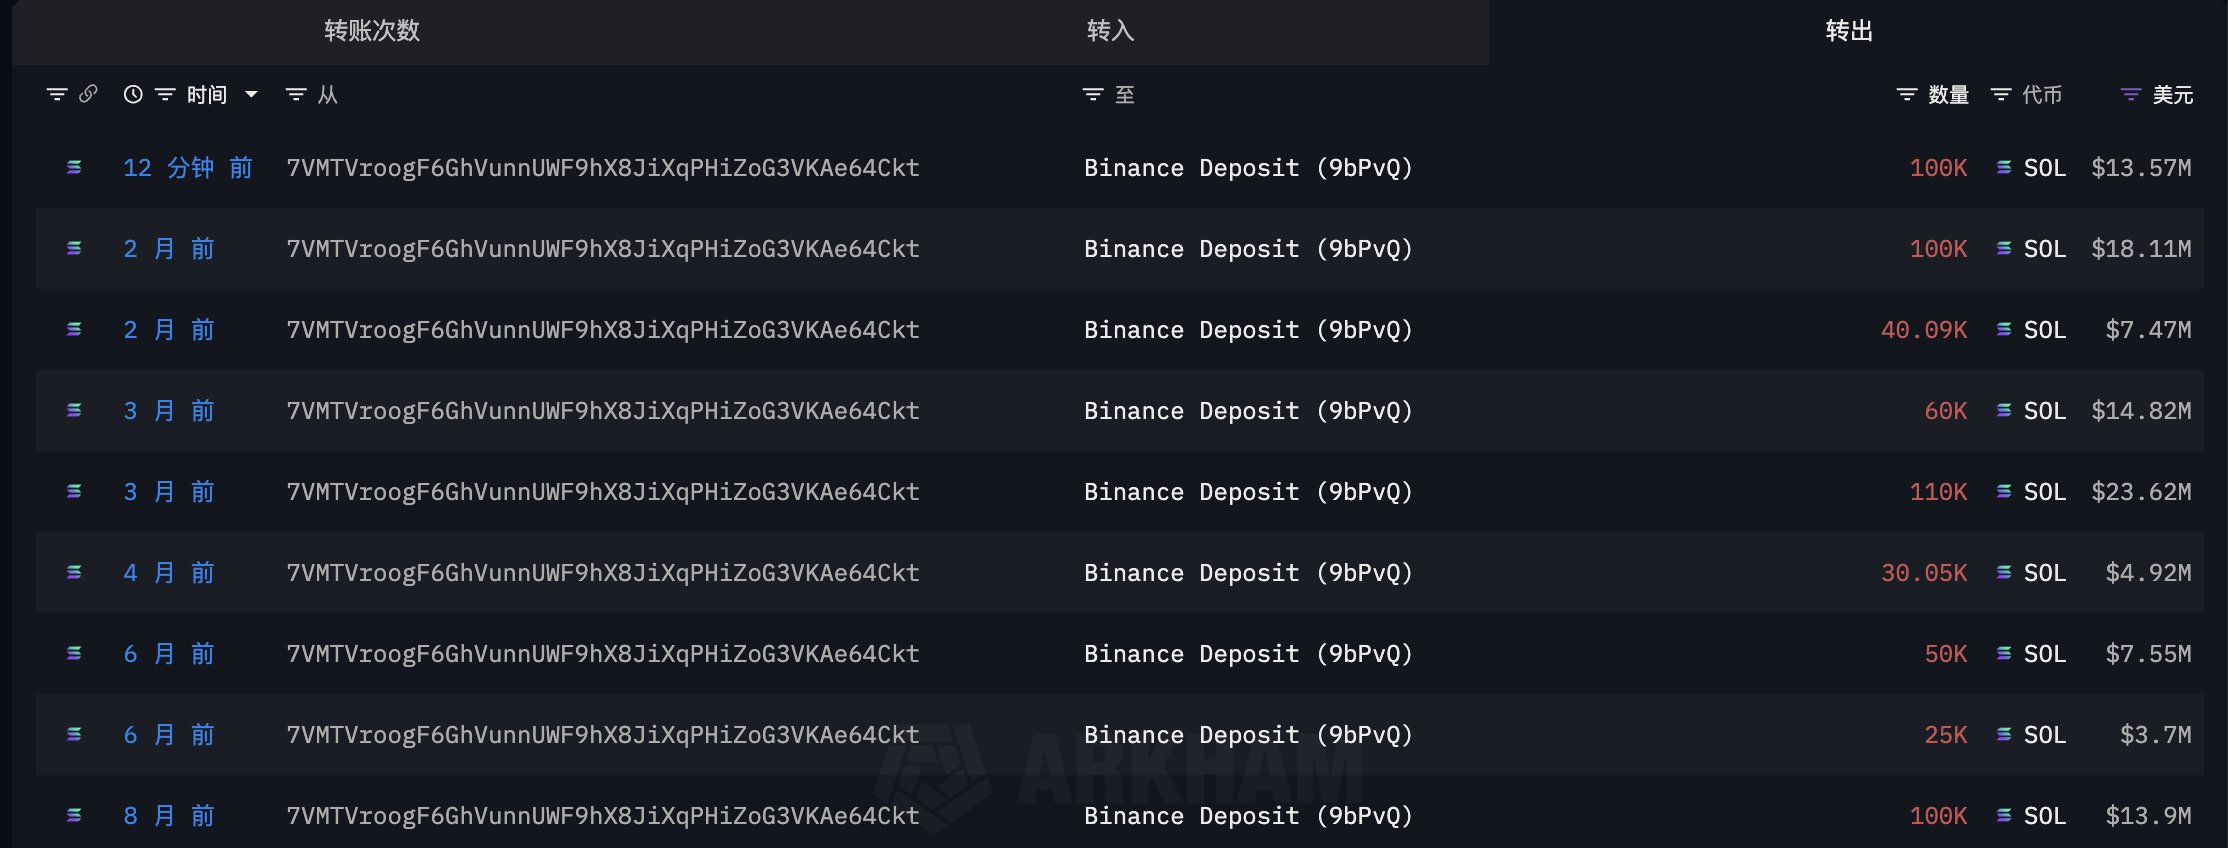
Source: EmberCN
Market analysts from platforms like CryptoQuant emphasize that sustained whale distributions can amplify volatility, especially in a bearish environment where retail investors follow suit. For Solana, this has contributed to a reinforcement of downward trends, with the asset’s price action reflecting total bear control. Technical analysis further supports this outlook: Solana’s Directional Movement Index (DMI) has entered oversold territory at 16, while the negative directional indicator (-DI) stands at 32, surpassing the positive directional indicator (+DI). This configuration, as observed on TradingView charts, indicates dominant selling pressure, displacing buyers and heightening the risk of additional declines.
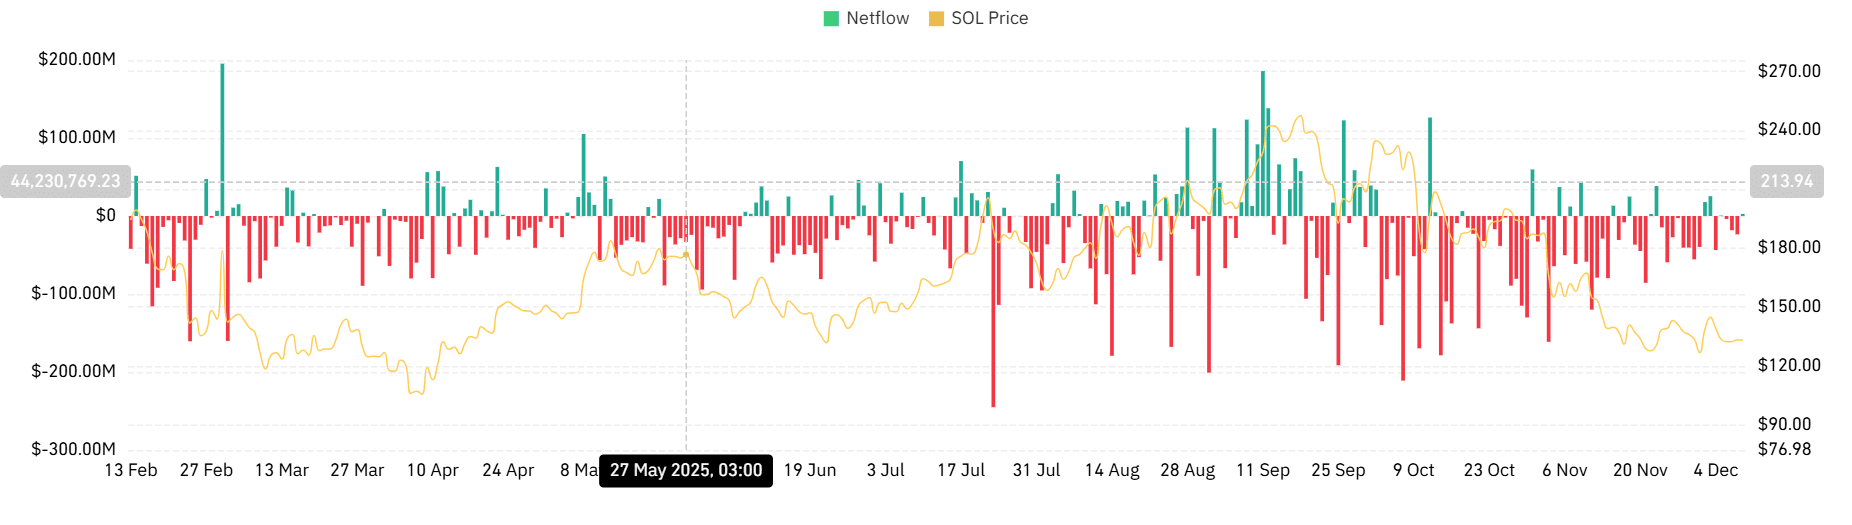
Source: CoinGlass
If whale selling persists, Solana could test lower supports at $130, potentially extending to $126 in the near term. Conversely, a bullish reversal would require a decisive daily close above $140, enabling a retest of $146 and possibly advancing toward the $178 level aligned with the middle Fibonacci Bollinger Band.
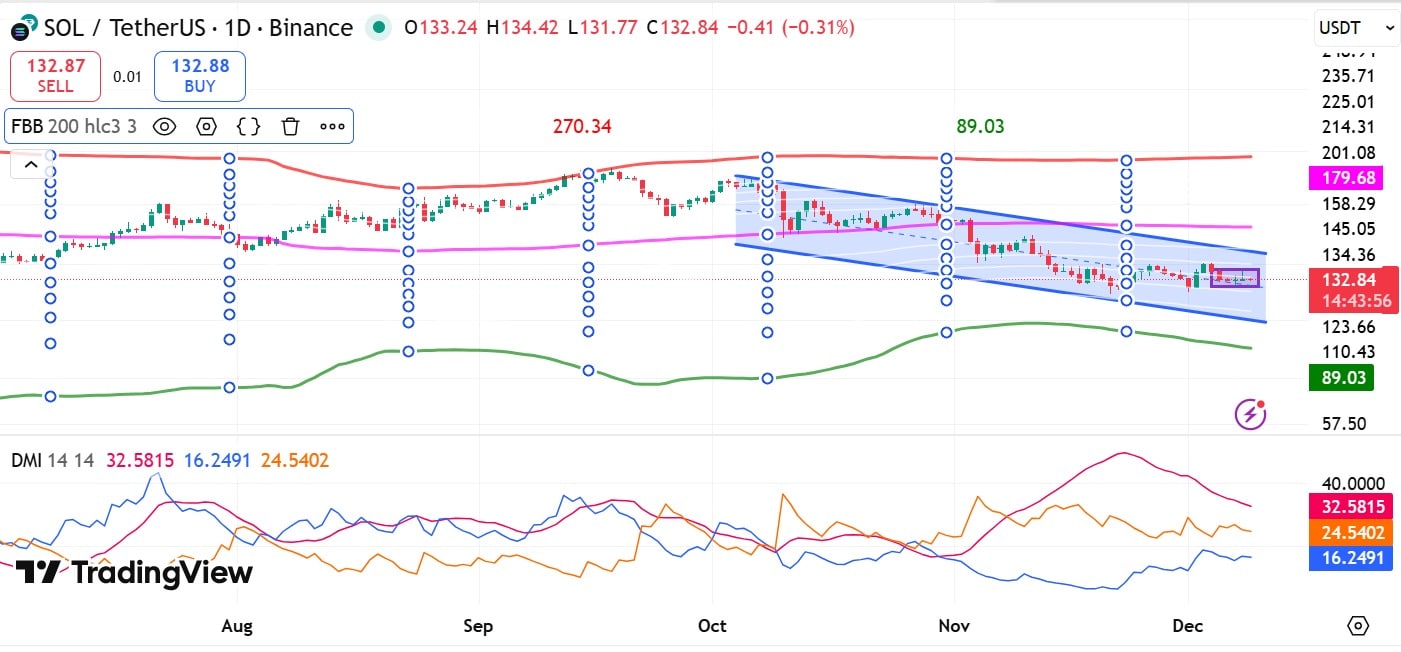
Source: TradingView
Broader context from on-chain data underscores Solana’s resilience despite these pressures. The network continues to process high transaction volumes, supported by its proof-of-stake mechanism and staking rewards that have rewarded long-term holders like this whale. Experts from CoinGlass note that while short-term outflows dominate, historical patterns show Solana rebounding from similar oversold conditions, often driven by ecosystem developments in decentralized finance and non-fungible tokens.
Frequently Asked Questions
Why is a Solana whale selling 100,000 SOL now?
A prominent Solana whale deposited 100,000 SOL worth $13.57 million to Binance as part of an ongoing profit-taking strategy that started in April. This holder has sold 615,000 SOL totaling $107 million over eight months, aiming to lock in gains amid bearish market signals and avoid potential further declines in SOL’s value.
What does positive Solana spot netflow mean for investors?
Positive spot netflow on Solana indicates more tokens are entering exchanges than leaving, often signaling impending sales by holders. At $2.66 million recently, this shift from negative flows suggests increased selling pressure, which could push prices lower in the short term, advising investors to monitor support levels closely for entry opportunities.
Key Takeaways
- Whale Distribution Patterns: A major holder offloaded 100,000 SOL to Binance, part of 615,000 SOL sold since April, highlighting profit realization in a stagnant market.
- Bearish Technicals: DMI at 16 and -DI at 32 confirm strong downward momentum, with risks of SOL falling below $130 if selling continues.
- Potential Reversal: A close above $140 could invalidate bearish trends, targeting $146 and higher resistance at $178 for bullish recovery.
Conclusion
Solana’s current trading range and whale activity reflect a cautious market, with significant offloads contributing to bearish pressure and potential further losses below $130. As Solana whale activity influences price dynamics, investors should watch technical indicators like DMI for shifts. With the network’s strong fundamentals intact, a rebound remains possible; consider monitoring key supports and resistances to inform your next moves in the evolving crypto landscape.