

Bitcoin Eyes $68K Support as $1.6B ETF Outflows Mount, K33 Calls $60K Bottom
BTC/USDT
$6,806,589,787.37
$64,980.00 / $64,280.00
Change: $700.00 (1.09%)
+0.0047%
Longs pay

Bitcoin News
Bitcoin traders are repositioning around lower support zones as derivatives flow and order book data reveal heavy buyer interest concentrated in the $68,000 to $70,000 region. The visible range volume profile points to that band as the most actively traded area since November 2025, indicating most existing positions cluster within that shelf. A daily bid-ask ratio of -0.03 confirms sellers remain more aggressive than buyers, while futures positioning tilts defensive. The behavior implies traders are prioritizing deeper liquidity pools rather than chasing breakouts above $80,000, betting that any retest of the $68K zone will draw decisive bids before momentum reverses higher.
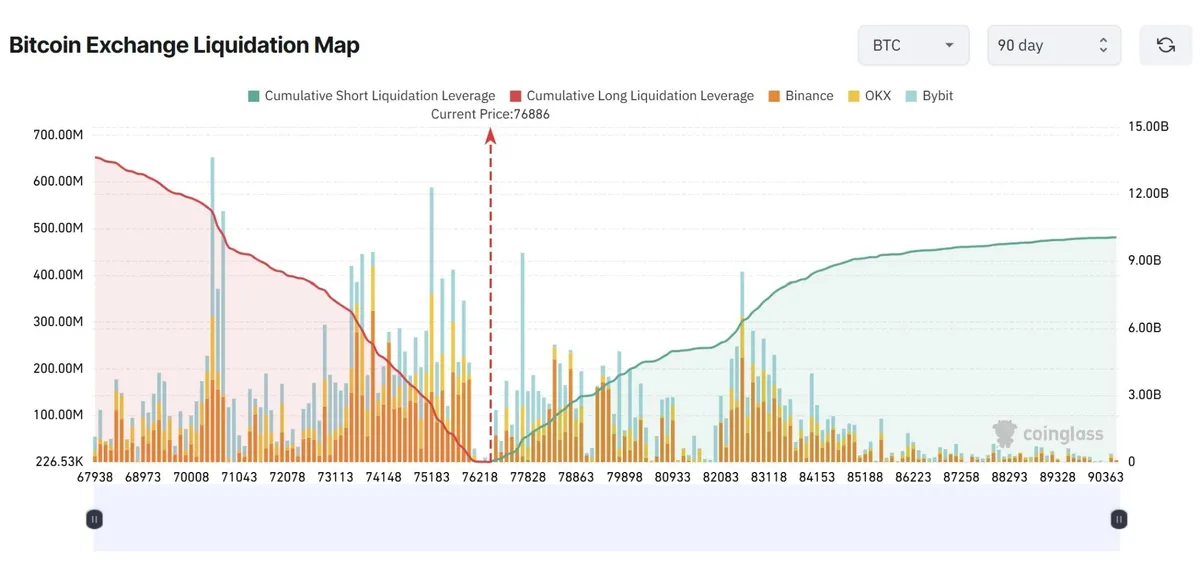
Liquidation mapping adds urgency to the lower-zone thesis. The current heatmap exposes more than $3.4 billion in cumulative long positions stacked near $74,700, with cascade risk rising sharply on any further decline. If Bitcoin slips to $70,000, the 90-day liquidation pool widens toward $11 billion in vulnerable longs, a level that would magnify any downside flush via forced selling. The data outlines a clear two-tier risk structure: a near-term squeeze pocket around $74.7K, and a deeper liquidity vacuum just above the $70K psychological floor. Traders are watching whether bids defend the upper boundary or whether capitulation triggers a cascade.
Retail positioning is flashing a contrarian warning. The True Retail Accounts long ratio has climbed back above 60%, placing crowd sentiment in the heavily bullish zone that historically precedes short-term local tops. Similar spikes preceded the early-May rejections near $78,000 to $82,000, where momentum quickly cooled once retail crowding became excessive. By contrast, the strongest reversals of this cycle emerged when fewer than 35% of retail accounts held longs, a setup last observed during the March and April lows before sharp rebounds. The current reading suggests the rally has limited fuel until retail sentiment resets meaningfully lower from current crowded levels.
A separate research lens argues this bear market looks structurally different from prior cycles. The thesis points to Bitcoin's failure to reclaim the 200-day moving average near $83,000, typically a precursor to deeper drawdowns in 2014, 2018, and 2022. Yet rather than producing the leverage-fueled rebound-and-collapse pattern of past cycles, the current grind has been notably restrained. The conclusion is that the February slide toward $60,000 likely marks the steepest drawdown of this cycle, framing a milder downturn that lacks the speculative excess required to break significantly lower from current trading ranges.
Derivatives data reinforces the defensive-posture argument. The 30-day average funding rate has remained negative for 81 consecutive days, approaching its longest stretch on record and indicating traders have stayed structurally bearish even during partial recoveries from the February lows. Annualized basis on CME Bitcoin futures has compressed below 2.5%, a level historically tied to periods of extreme caution rather than euphoric positioning. The combination of persistent negative funding plus suppressed basis paints a market drained of speculative leverage, reducing the risk of the cascade-driven collapses that defined prior cycle downlegs and supporting the less aggressive bull-market framing for 2025.

The counterweight comes from spot ETF flows, which have accelerated sharply to the downside. Roughly $1.6 billion exited U.S. Bitcoin ETF products over a five-day stretch as prices softened near $83,000, a level close to the average cost basis of many ETF holders. Historical patterns show investors tend to sell most aggressively when prices recover back toward breakeven after prolonged drawdowns, and that behavior appears to be repeating now. Elevated open interest across Bitcoin derivatives compounds the risk: even with disciplined leverage, a sustained break below current support could still trigger a volatility event as remaining positions unwind.
With live spot pricing and momentum oscillators unavailable for this update, the technical map still resolves around clear structural zones. The $68,000 to $70,000 cluster anchors the primary support shelf, while the 200-day moving average near $83,000 functions as the dominant resistance ceiling. A daily close above $83K would invalidate the bear-continuation thesis and open the path toward retesting prior range highs above $90K. Conversely, a decisive breakdown below $68K on rising volume would expose the $60K bottom-zone retest. Funding rate normalization and ETF flow stabilization remain the earliest reversal signals worth tracking closely from here.
COINOTAG does not provide financial advisory services. This content is for informational purposes only and should not be considered investment advice. Cryptocurrency investments involve high risk.
Add COINOTAG as a Preferred Source
Add COINOTAG to your preferred sources in Google News and Search to see our coverage first.
Add on GoogleRelated Tags
AI-generated, AI-reviewed, under COINOTAG editorial oversight.
Comments
More From COINOTAG
Bitcoin Near $65K as Saylor Frames Corporate Adoption as Inevitable
July 19, 2026 at 04:40 AM UTC
Bitcoin and Risk Assets Braced for Deeper 2027 Correction, Strategist Warns
July 19, 2026 at 03:13 AM UTC
AWS Quadrillion-Dollar Billing Glitch Renews Bitcoin Exchange-Outage Fears
July 19, 2026 at 02:37 AM UTC