Ethereum Faces Indecision at $3,000: Will Price Break Out or Fall Below Key Support Levels?
ETH/USDT
$39,049,302,904.94
$2,145.26 / $2,009.54
Change: $135.72 (6.75%)
-0.0018%
Shorts pay
Contents
-
Ethereum faces challenges maintaining its upward momentum, currently resting around the $3,000 mark after a significant drop of 18% over the past month.
-
Despite recent fluctuations, key indicators suggest a notable level of market indecision, with the RSI remaining neutral at 54.8 for 16 consecutive days.
-
As noted by COINOTAG, “Ethereum’s price action indicates a critical moment where a breakout or breakdown could vastly determine its future trajectory.”
Explore the latest Ethereum trends as the cryptocurrency hovers around $3,000, with key indicators showing uncertainty and potential for movement.
Vital Signs of Ethereum’s Current Market Status
Ethereum (ETH) is currently in a precarious position as it struggles to reclaim the $3,000 threshold following an 18% decline over the previous month. The market dynamics appear convoluted, marked by fluctuating technical indicators that signal mixed sentiments among investors.
Recent attempts at bullish recovery were curtailed by a lack of solid momentum, leaving ETH in a consolidation phase as it navigates market waves. The combined analysis of the Relative Strength Index (RSI) and Directional Movement Index (DMI) sheds light on potential directions for ETH’s next move.
The Role of RSI in Ethereum’s Performance
At present, the RSI stands at a neutral 54.8, reflecting a balance between buying and selling pressures. This neutral position comes after a recent high of 62 and a temporary dip to 39.1, illustrating a volatile trading environment.
With the RSI stabilizing mid-range, the absence of a pronounced buying or selling force persists, as indicated by ongoing neutral signals. The last recorded overbought condition above 70 was on January 6, suggesting the cryptocurrency has struggled to maintain an upward trajectory amid prevailing uncertainties.

ETH RSI. Source: TradingView.
DMI Insights into Market Indecision
The Directional Movement Index (DMI) portrays Ethereum’s current market condition, with the Average Directional Index (ADX) at 10.2, a noticeable decline from previous readings. This downturn indicates a weakening trend strength, highlighting a market characterized by indecision.
The current DMI data reveals that ETH’s upward momentum might be fading, with the +DI at 24.5, down from a higher level of 31.2 just days before. The decrease signals faltering bullish support following a brief rally associated with broader market events, such as the recent Solana meme coin wave.

ETH DMI. Source: TradingView.
Navigating Potential Price Movements
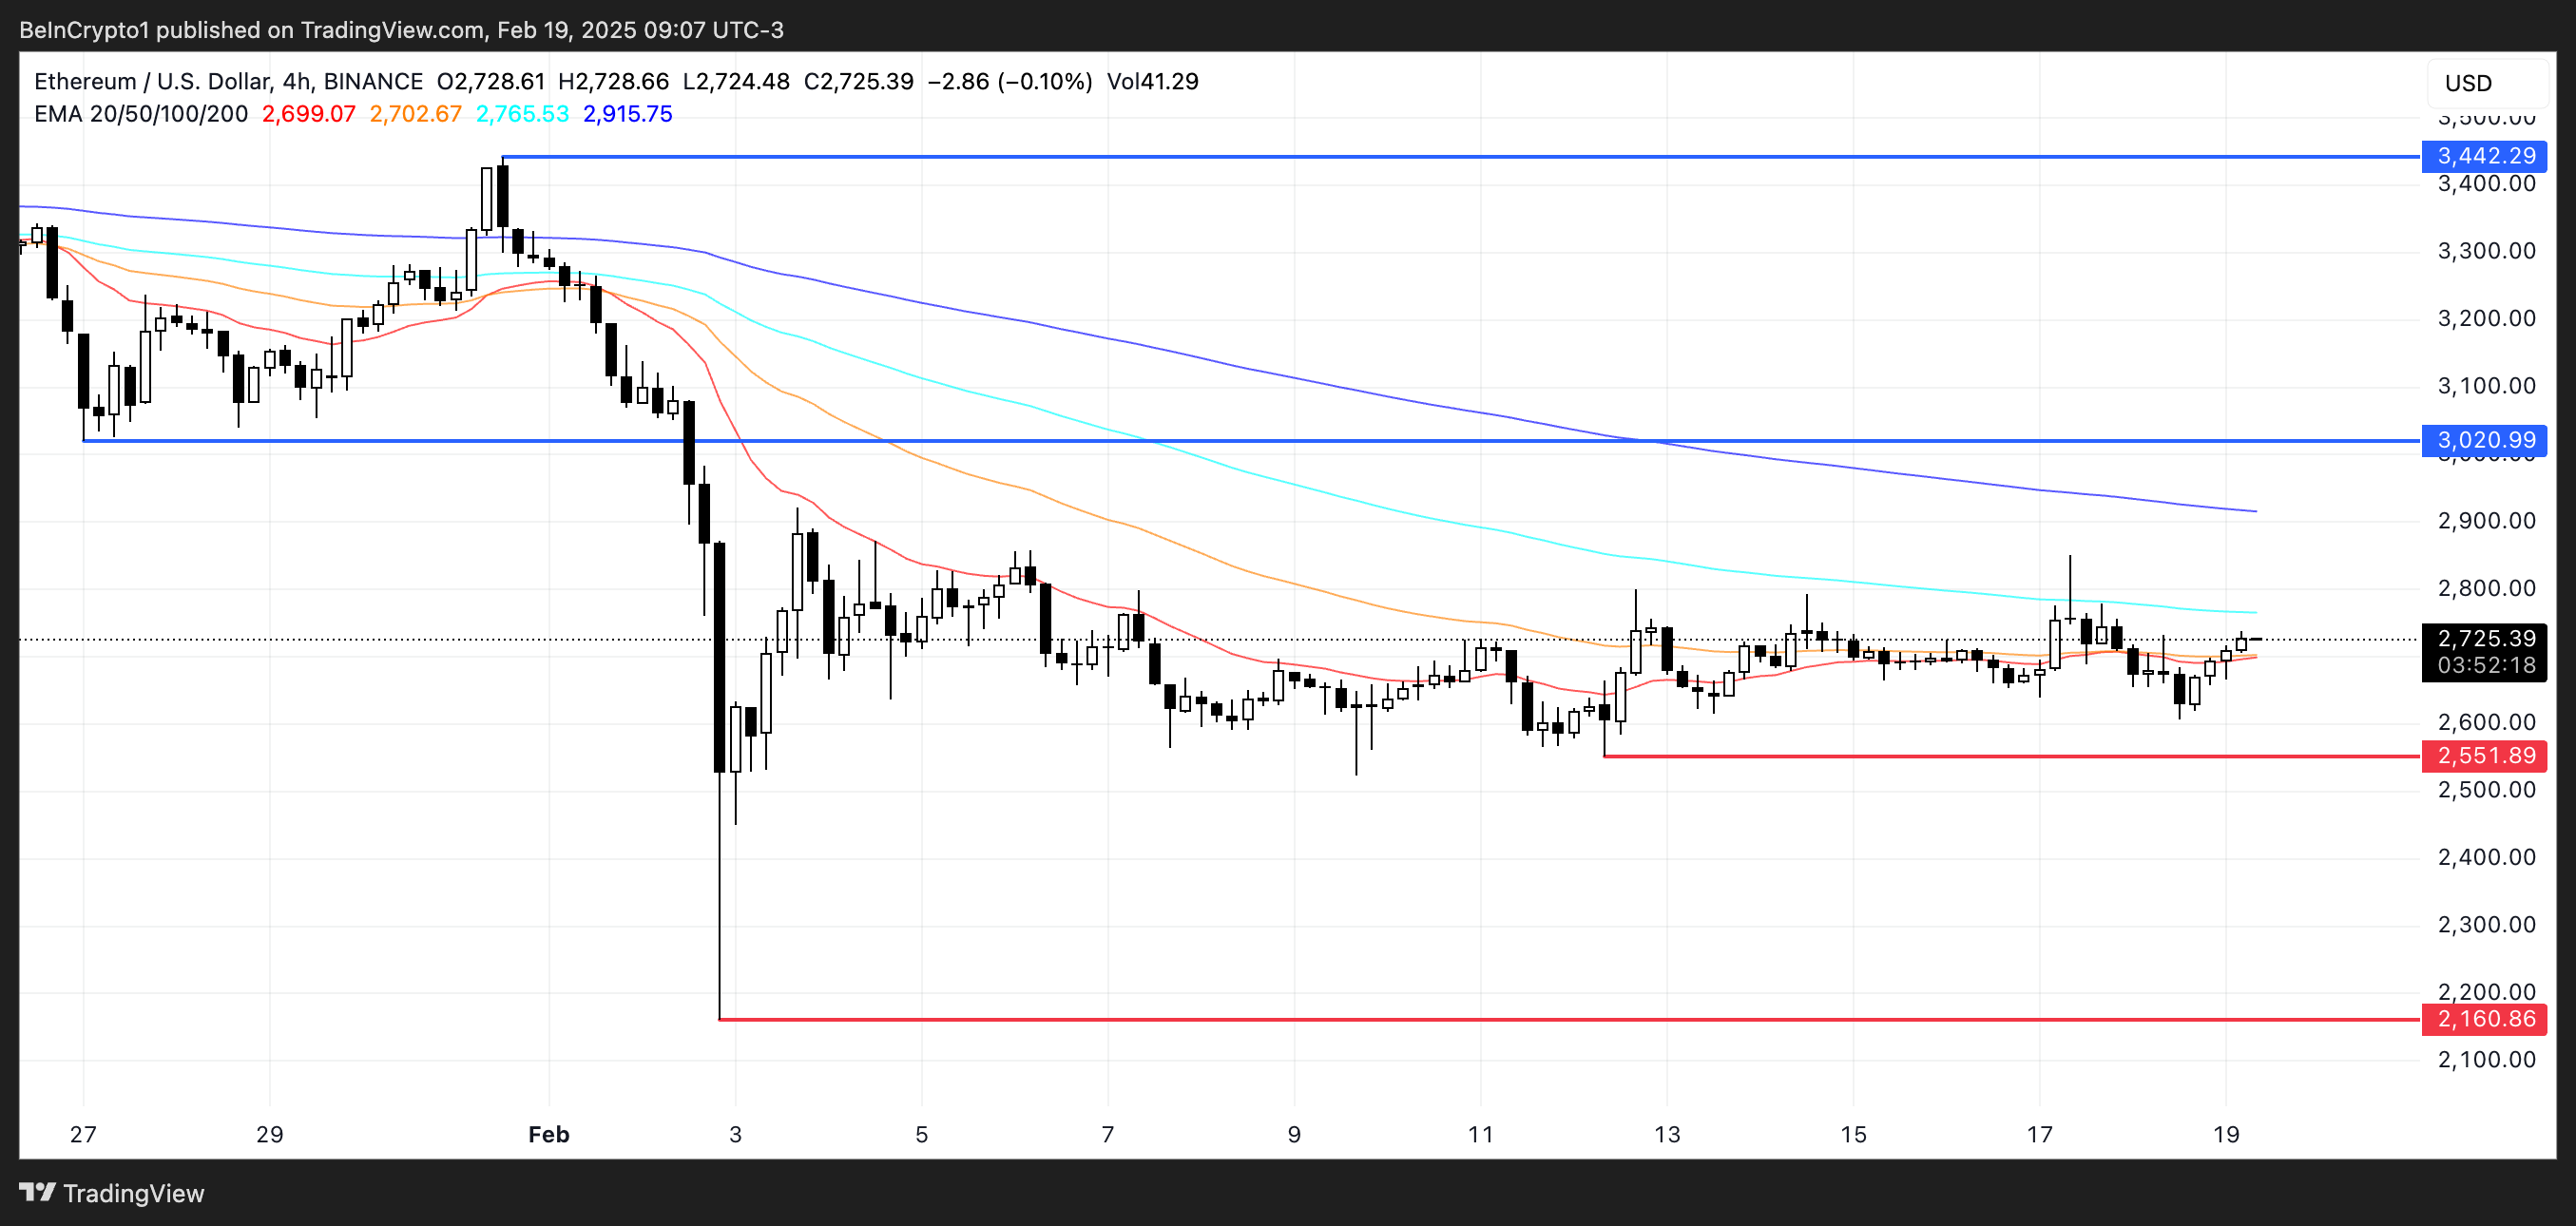
Looking ahead, ETH’s immediate prospects appear contingent on its ability to break through the psychological resistance around $3,020. A sustained rally past this point could signal the beginning of a bullish phase, with the next major resistance set at $3,442.
Conversely, failure to generate upward momentum could bring Ethereum closer to testing critical support levels at approximately $2,551, potentially leading to further downward movements toward $2,160. Maintaining awareness of these levels is crucial for traders and investors alike.

ETH Price Analysis. Source: TradingView.
Conclusion
In conclusion, Ethereum’s current status illustrates a market caught between past volatility and forthcoming key price levels. With the future uncertain, it remains critical for traders to monitor RSI and DMI signals as indicators of whether ETH will break free from stagnation or continue to navigate a range-bound scenario.
