Waves Coin Review and Analysis! The Decline May Continue!

Contents
- Waves experienced a drop of more than 5% today.
- Can Waves coin drop to the level of $1.66?
- Levels that Waves investors should follow!
Will Waves coin continue to decline? What will be the future of Waves? Waves coin price prediction! Current Waves analysis!
Medium-Term Waves Coin Analysis!
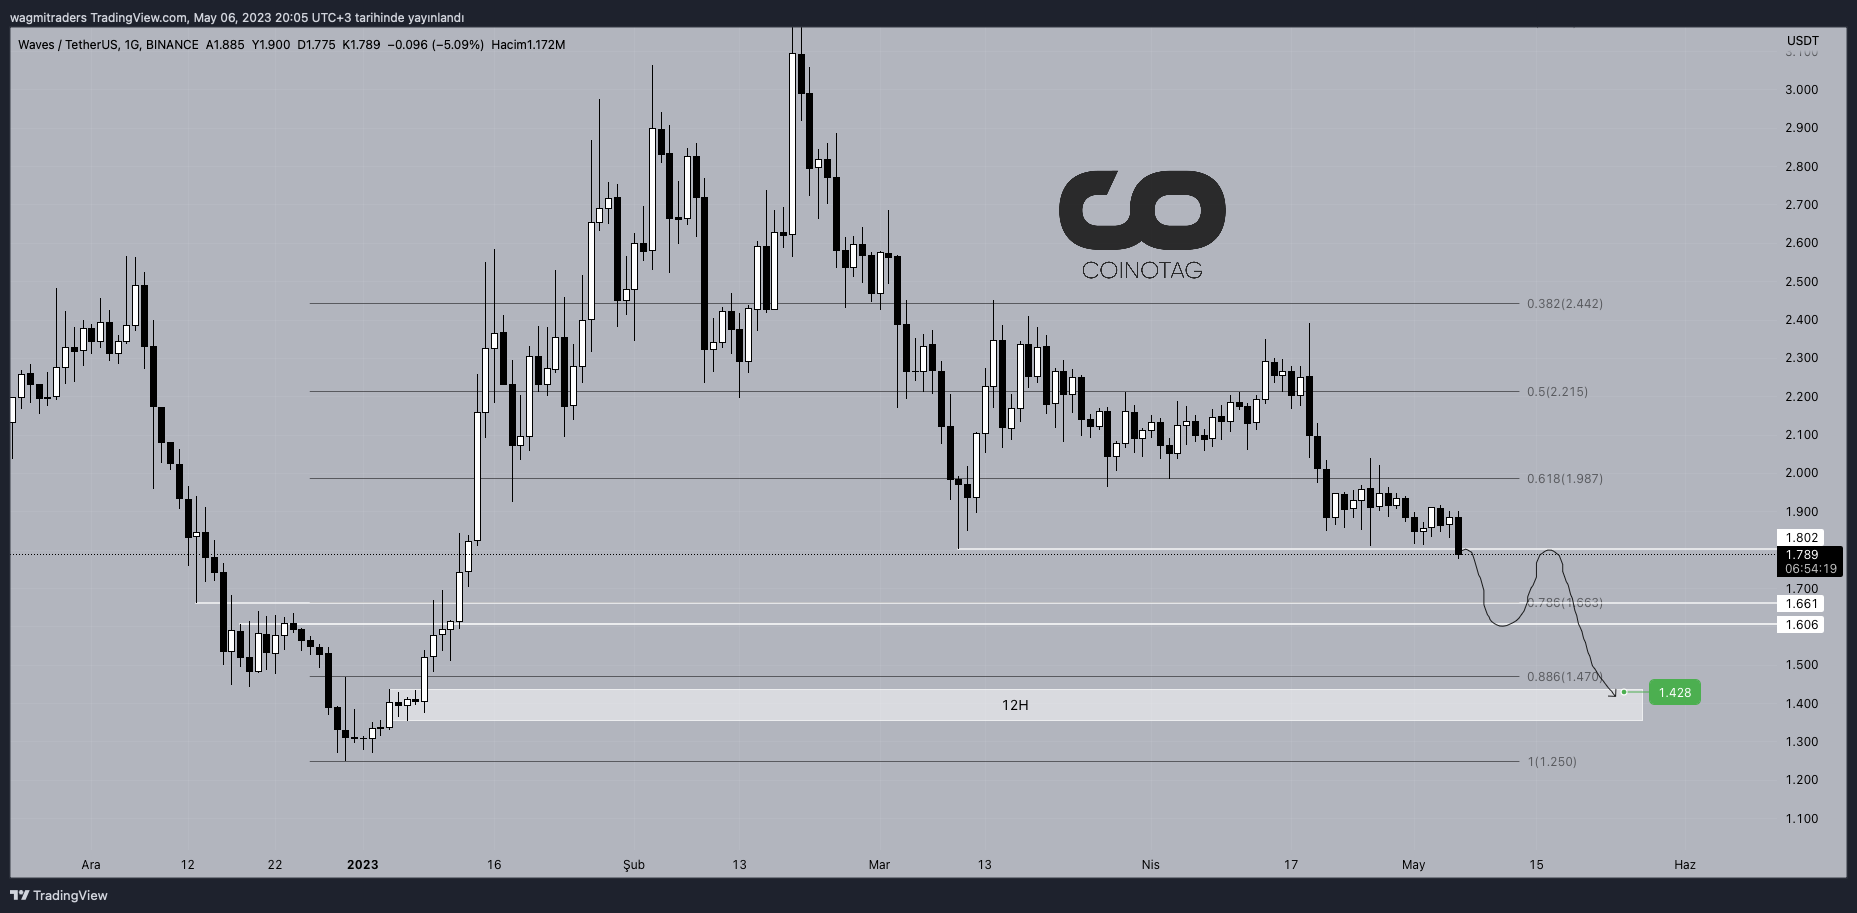
Daily Waves Price Chart Source: TradingView
When we examine the Waves coin chart, it is trading below the important support level of $1.80. Waves coin was trading around $1.791 at the time of writing.
If Waves price makes daily candlestick closures below the level of $1.80 mentioned in the analysis, it can realize the downward movement to the range of $1.66 – $1.61.
The important support range that Waves should be followed is the levels of $1.66 – $1.61. If Waves coin makes daily candlestick closures below the level of $1.61, it can realize the downward movement to the level of $1.428.
The above Waves price chart contains important Fibonacci zones. You can click on the visual to examine it in detail.
If Waves coin continues to make daily candlestick closures above the level of $1.80, the price target will be the level of $1.98 mentioned in the analysis.
Add COINOTAG as a Preferred Source
Add COINOTAG to your preferred sources in Google News and Search to see our coverage first.
Add on GoogleComments
Other Articles
Bitcoin Traders Have These Support Levels in Mind as $80,000 Battle Returns
May 8, 2026 at 11:00 AM UTC
SpaceX, OpenAI, Anthropic Eye Possible 2026 IPOs at Sky-High Valuations
January 1, 2026 at 09:01 AM UTC
Nvidia H200 Chip Demand from China Could Strain Supply as TSMC Eyes 2026 Ramp-Up
December 31, 2025 at 09:19 AM UTC