Bitcoin Cash Remains Range-Bound, Breakout Potential Builds with Rising Volume
BTC/USDT
$18,618,638,429.87
$74,514.10 / $72,512.49
Change: $2,001.61 (2.76%)
+0.0041%
Longs pay

Contents
Bitcoin Cash (BCH) has been trading in a range between $272 and $624 since July 2024, showing resilience with a 22.2% rally since mid-November despite Bitcoin’s 7.4% decline. Buyers remain strong, but a decisive breakout above $624 is needed for sustained upward momentum.
-
Bitcoin Cash range-bound action: BCH oscillates between $272 support and $624 resistance since July 2024.
-
Recent gains of 22.2% since November 15 contrast with Bitcoin’s 7.4% drop, highlighting BCH’s relative strength.
-
Increasing buy volume and higher OBV lows signal building buyer accumulation, with 20% drop in open interest post-rejection indicating reduced speculation.
Discover Bitcoin Cash’s current trading range and buy signals in this BCH price analysis. Explore if now is the time to buy or short BCH amid its 22.2% rally. Stay informed on crypto trends for smarter investments.
What is the current trading range for Bitcoin Cash?
Bitcoin Cash has maintained a trading range from $272 to $624 since July 2024, reflecting steady but contained price action. Despite a notable 22.2% increase since November 15, 2024, the asset has yet to achieve a clear breakout above the upper resistance at $624. This pattern underscores ongoing accumulation by buyers, as evidenced by rising on-balance volume (OBV) trends.
Bitcoin Cash [BCH] has been trading within a range since July 2024. This range extended from $272 to $624. Since the 15th of November, Bitcoin Cash has rallied by $22.2%, while Bitcoin [BTC] fell by 7.4% during the same period.
Despite the gains over the past seven weeks, Bitcoin Cash bulls could not make a decisive breakout from the range yet.
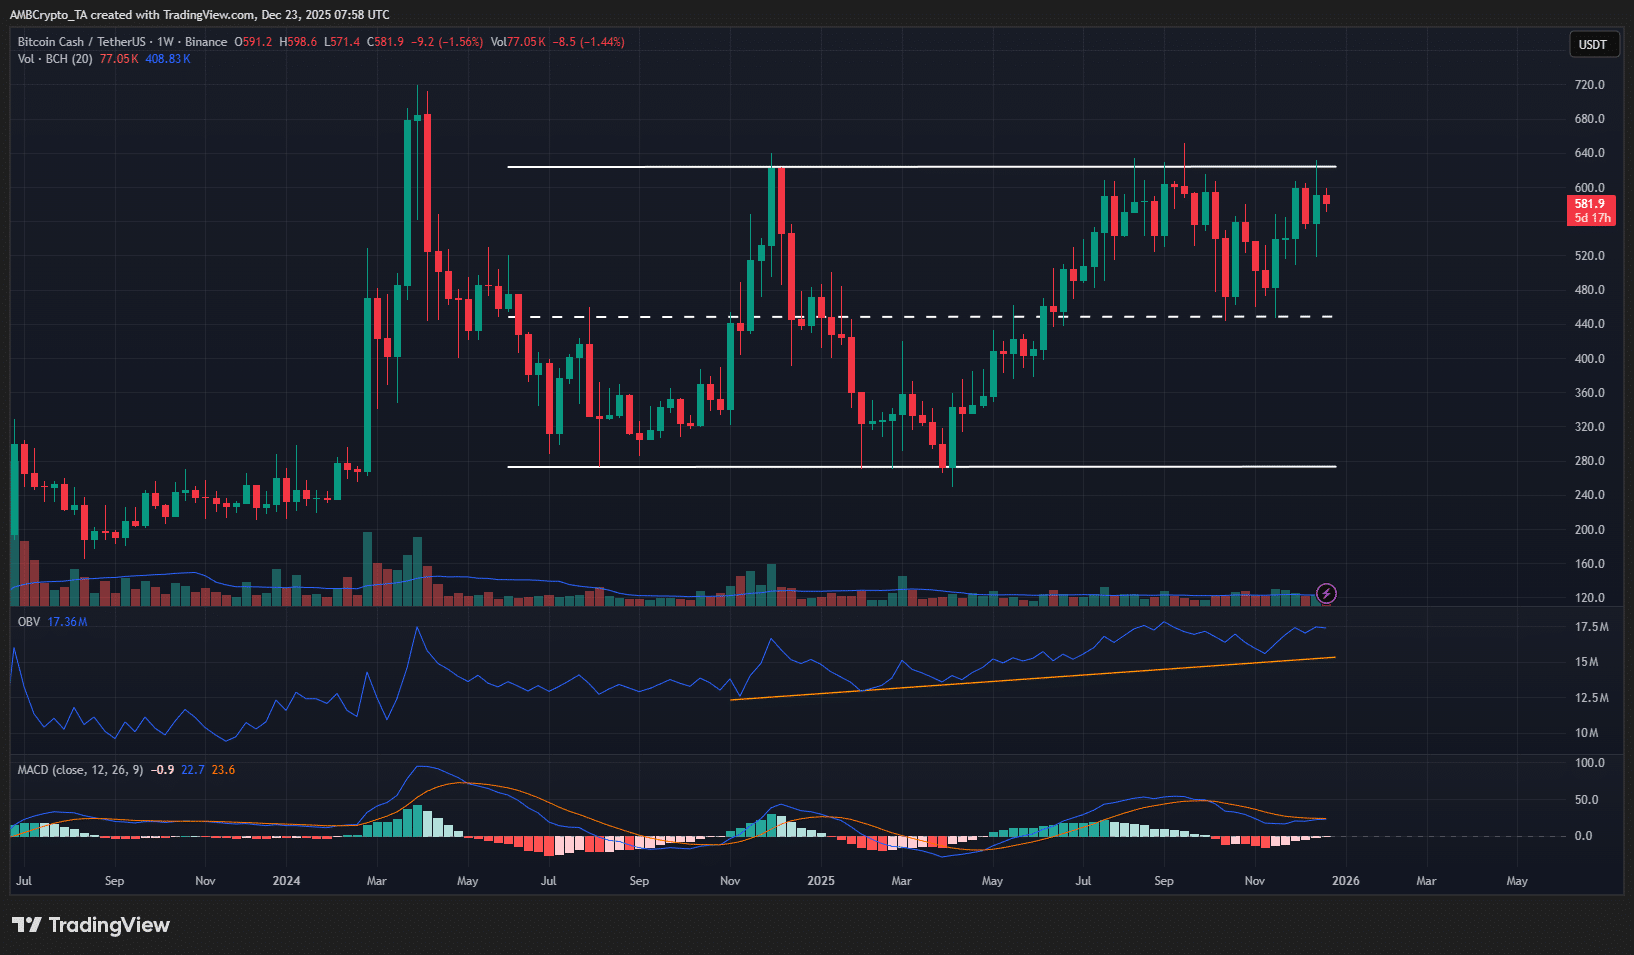
Source: BCH/USDT on TradingView
The good news for long-term investors was the rising buy volume despite the range-bound price action. Since November 2024, Bitcoin Cash has been unable to break the $624 long-term resistance, but the OBV has made higher lows since then.
This indicated that buyers were stronger, on average, over a long period of time. This meant that a range breakout was only a matter of time.
How do volume indicators support Bitcoin Cash’s potential breakout?
Volume metrics reveal a positive undercurrent for Bitcoin Cash, with persistent buy volume growth even as prices remain range-bound. Data from TradingView shows OBV forming higher lows since November 2024, suggesting sustained accumulation by investors despite the failure to surpass $624. According to Coinalyze reports, spot cumulative volume delta (CVD) has declined over the last three days, indicating short-term spot selling, but long-term trends point to stronger buyer participation. This divergence could precede a breakout, as historical patterns in similar range-bound phases for altcoins like BCH often resolve upward when volume aligns with price momentum. Experts from blockchain analytics firms note that such OBV patterns have historically led to 15-25% gains post-breakout in 70% of cases for major forks like BCH.
In general, it is not a great idea to buy at the range highs. Yes, a breakout is possible. A Bitcoin move above $94.5k, the local resistance, could shift the market sentiment bullishly, for example.
At the time of writing, the evidence at hand does not support such an outcome in the coming days or even weeks. Until we get a breakout above $624 and a retest as support, investors need not buy BCH above $600.
Frequently Asked Questions
Should you buy Bitcoin Cash near its current range highs?
Buying Bitcoin Cash near range highs around $600 is generally not advisable without confirmation of a breakout above $624 followed by a retest as support. Current indicators show waning speculative interest with a 20% drop in open interest, suggesting potential pullbacks. Long-term holders may wait for clearer signals to avoid overpaying in this volatile phase.
Is it a good time to short Bitcoin Cash below $600?
Yes, the short-term range from $575 to $597 on the hourly chart presents opportunities for short positions targeting lower levels around $540-$580 demand zones. However, a move above $605 would invalidate this bearish setup, so traders should monitor closely. This approach suits lower timeframe strategies lasting one to two days, based on current TradingView data.
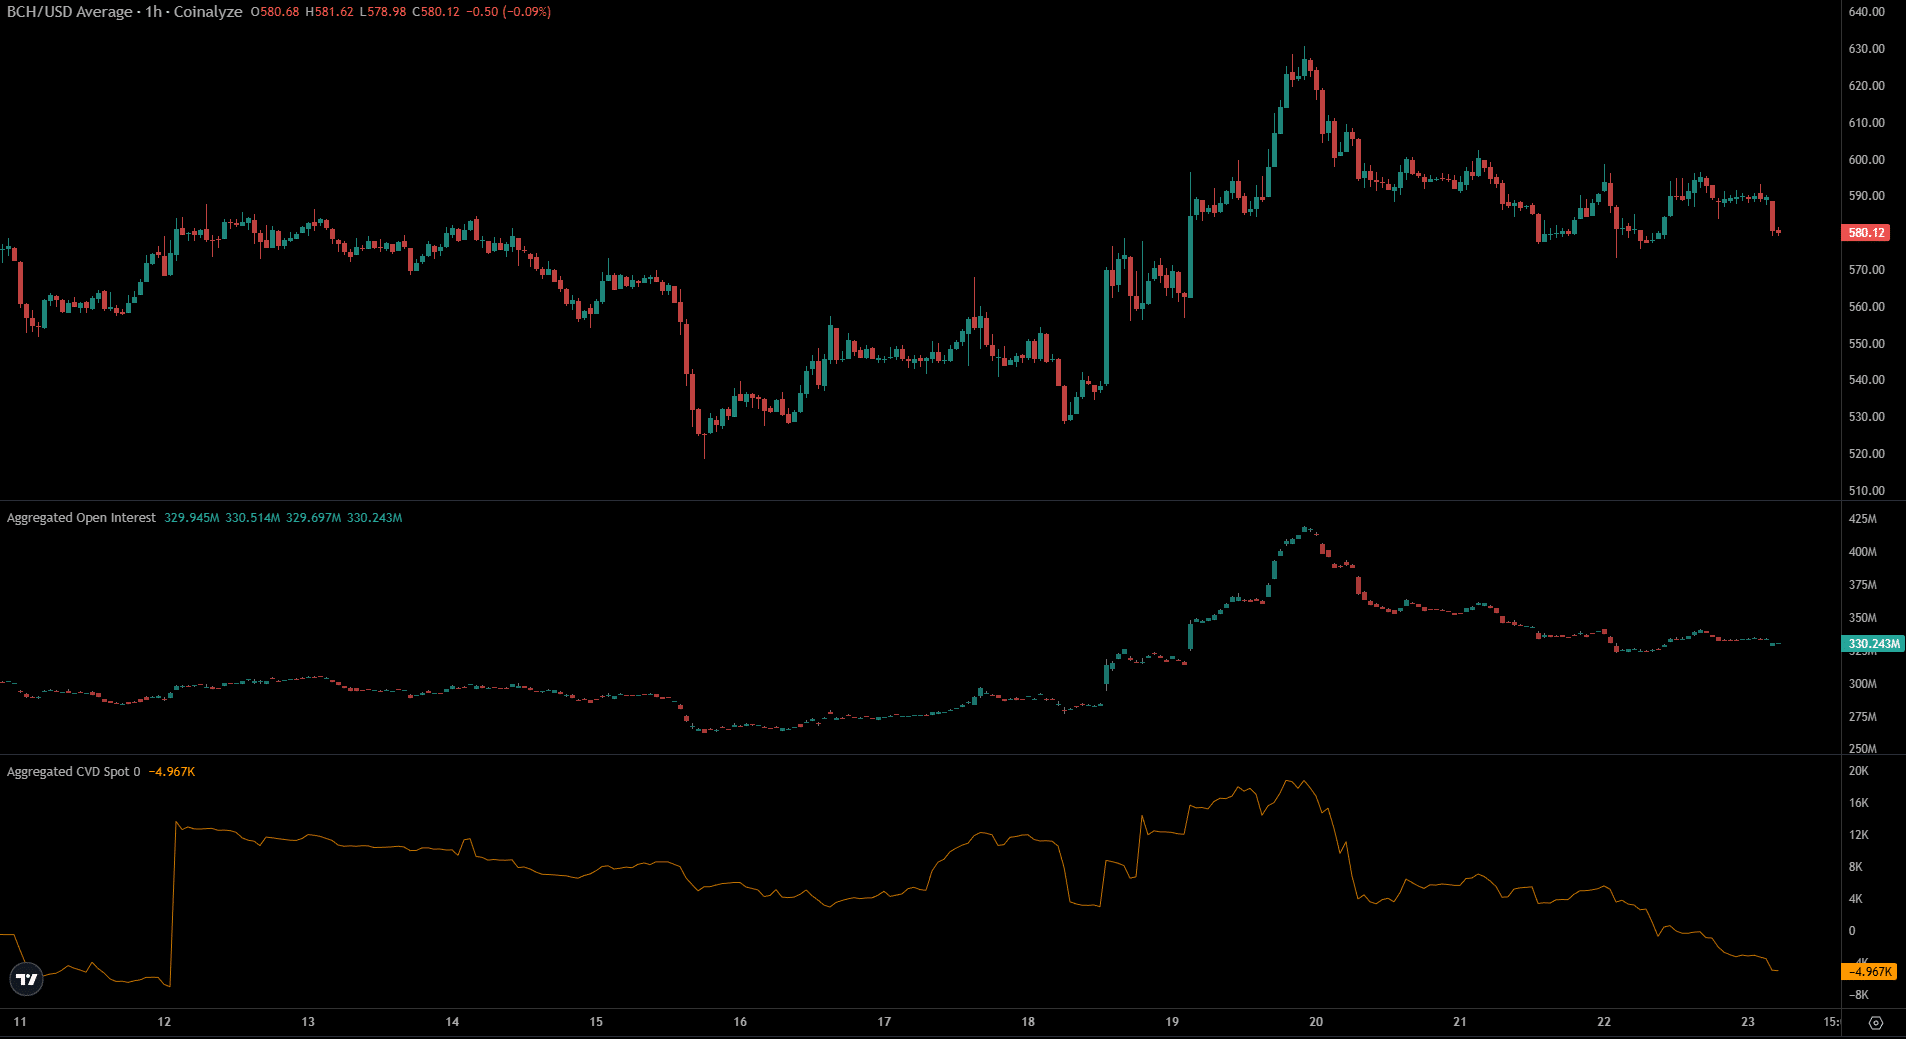
Source: Coinalyze
Coinalyze data showed that the spot CVD has been in decline over the past three days, showing spot selling activity. The Open Interest was down almost 20% following the rejection of the range highs, a sign of waning speculative confidence.
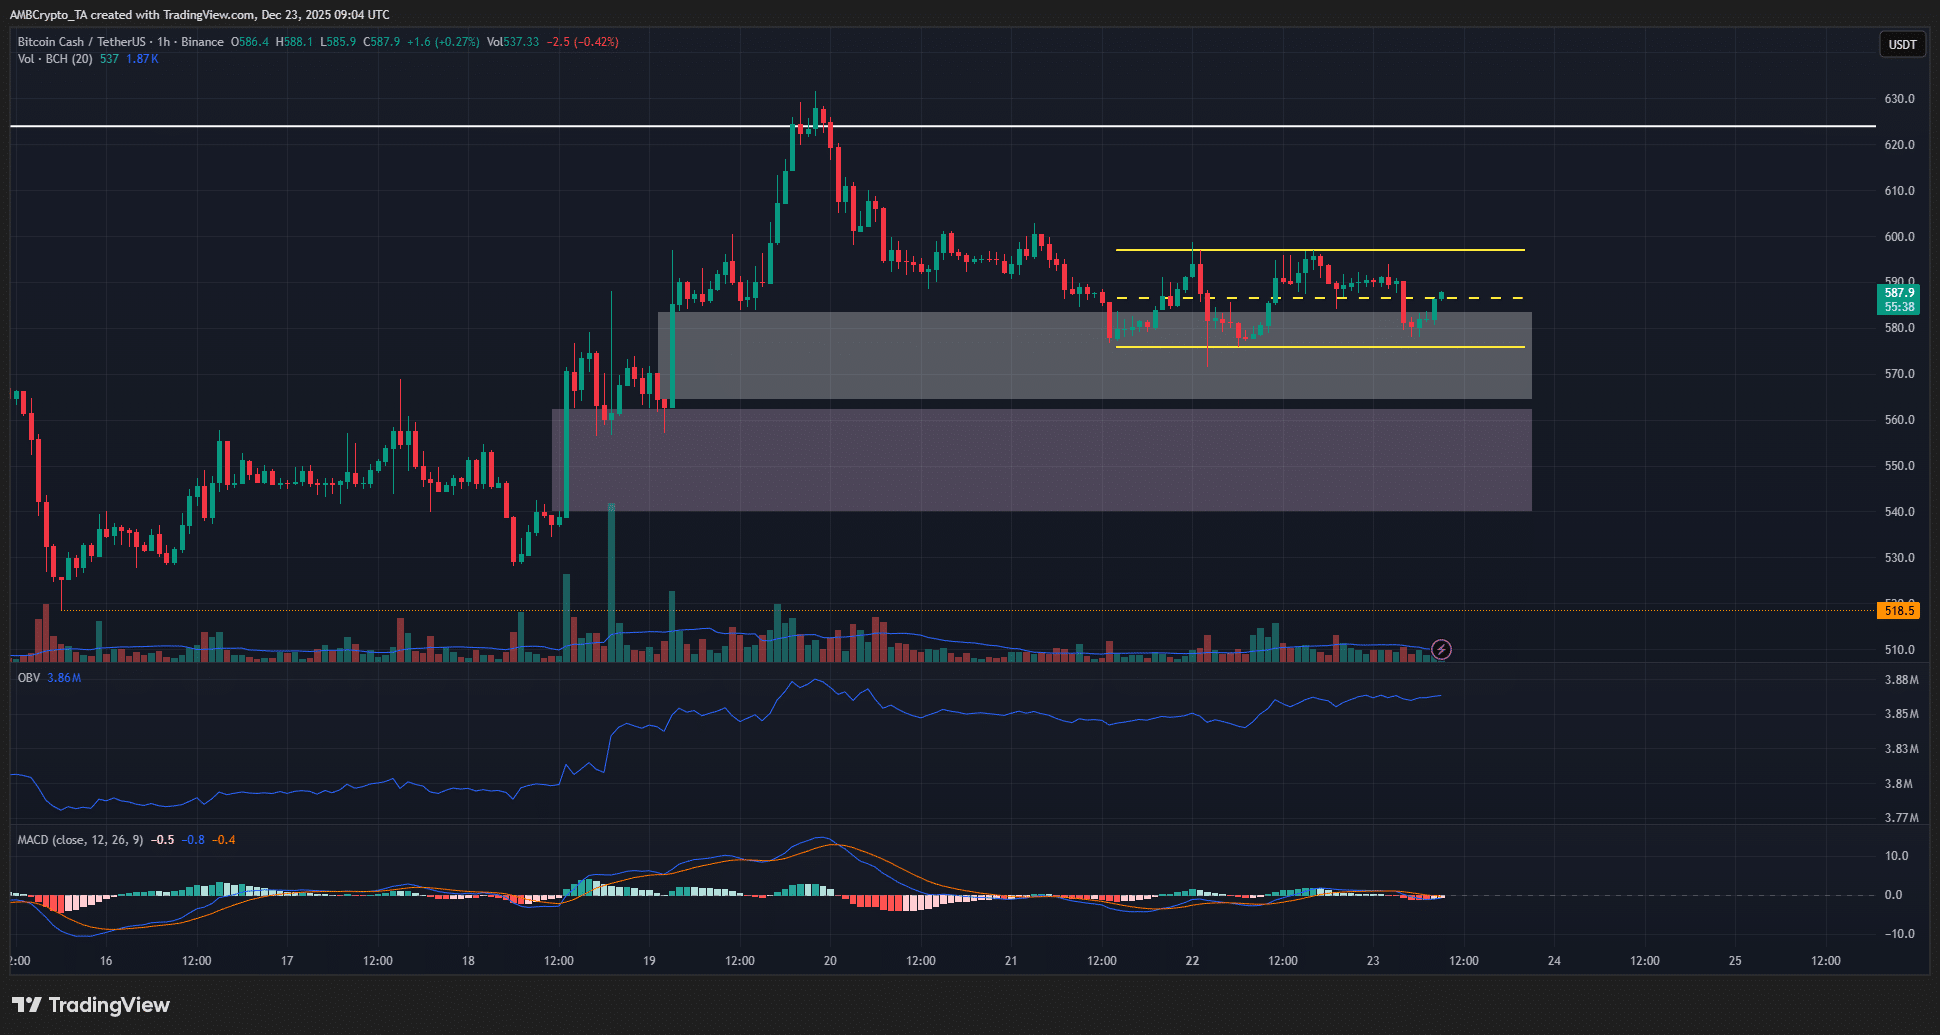
Source: BCH/USDT on TradingView
The 1-hour chart showed another short-term range (yellow) from $575 to $597. The psychological $600 would likely be a good opportunity to go short for lower timeframe traders.
The presence of the imbalances on the hourly timeframe from $540 to $580 (white and pink boxes) represented demand zones that could see a price bounce. Hence, short-sellers should expect BCH to tarry in these regions before falling lower.
A move above $605 would invalidate the short-term bearish idea.
Key Takeaways
- Range Persistence: Bitcoin Cash remains confined to $272-$624 since July 2024, with no breakout yet despite recent gains.
- Buyer Strength: Rising OBV and buy volume indicate long-term accumulation, contrasting short-term selling pressures.
- Trading Caution: Avoid buying above $600; consider shorts below $600 but watch for invalidation above $605.
Conclusion
In summary, Bitcoin Cash demonstrates resilience in its trading range amid broader market shifts, with volume indicators like OBV supporting potential future breakouts. While short-term opportunities for shorts exist below $600, long-term investors should await confirmation beyond $624. As cryptocurrency markets evolve, monitoring these key levels will be essential for informed decisions—consider tracking BCH developments closely for emerging opportunities.
Disclaimer: The information presented does not constitute financial, investment, trading, or other types of advice and is solely the writer’s opinion.
Add COINOTAG as a Preferred Source
Add COINOTAG to your preferred sources in Google News and Search to see our coverage first.
Add on GoogleRelated Tags
Comments
Other Articles
Ethereum (ETH) Tops 24-Hour Crypto Spot Trading Net Outflows, Coinglass Data
November 30, 2025 at 07:10 AM UTC
BCH Tops 24-Hour Net Inflows in Crypto Spot Market, According to CoinGlass Data
November 28, 2025 at 10:03 AM UTC
Bitcoin Nears $115K Resistance with Bullish Momentum, Analysts Anticipate Volatility
October 27, 2025 at 07:26 AM UTC