

Bitcoin May Rally: Historical and Technical Signals
BTC/USDT
$8,537,898,104.63
$63,796.33 / $62,552.04
Change: $1,244.29 (1.99%)
+0.0017%
Longs pay

Bitcoin closed April at 76.110,83 dollars, following a cautious trajectory. BTC, fixed at the current price level of 78.544,56 dollars (%0,09 daily increase), is wandering in the neutral zone with RSI 61,47 while exhibiting a sideways trend. Historical data reveals that the largest cryptocurrency generally shows gains in May; out of the 13 years since 2013, it ended with gains seven times. Following the approximately %10 increase in April, this seasonal tendency indicates that the overall upward trend may continue.
Bitcoin May Historical Performance
Bitcoin's May statistics are promising for investors. In 13 years of data, an average %15 gain has been achieved with a %54 success rate. This year's BTC detailed analysis data supports a similar scenario. However, caution is advised against misleading signals in bear markets.
Institutional ETF Inflows and Market Support
Net inflows of 1,8 billion dollars into US spot ETFs this month and 1,32 billion dollars in March reinforce the strength of institutional demand. The S&P 500 trading near record levels also supports similar optimism. These inflows are also strengthening BTC in the BTC futures market.
Bond Yields Pressure on BTC
The market has entered a digestion process under the pressure of rising bond yields; risky assets are struggling as the 30-year US Treasury yield approaches %5. The Supertrend indicator is giving a bearish signal, while holding above EMA 20 (76.041,82$) is critical.
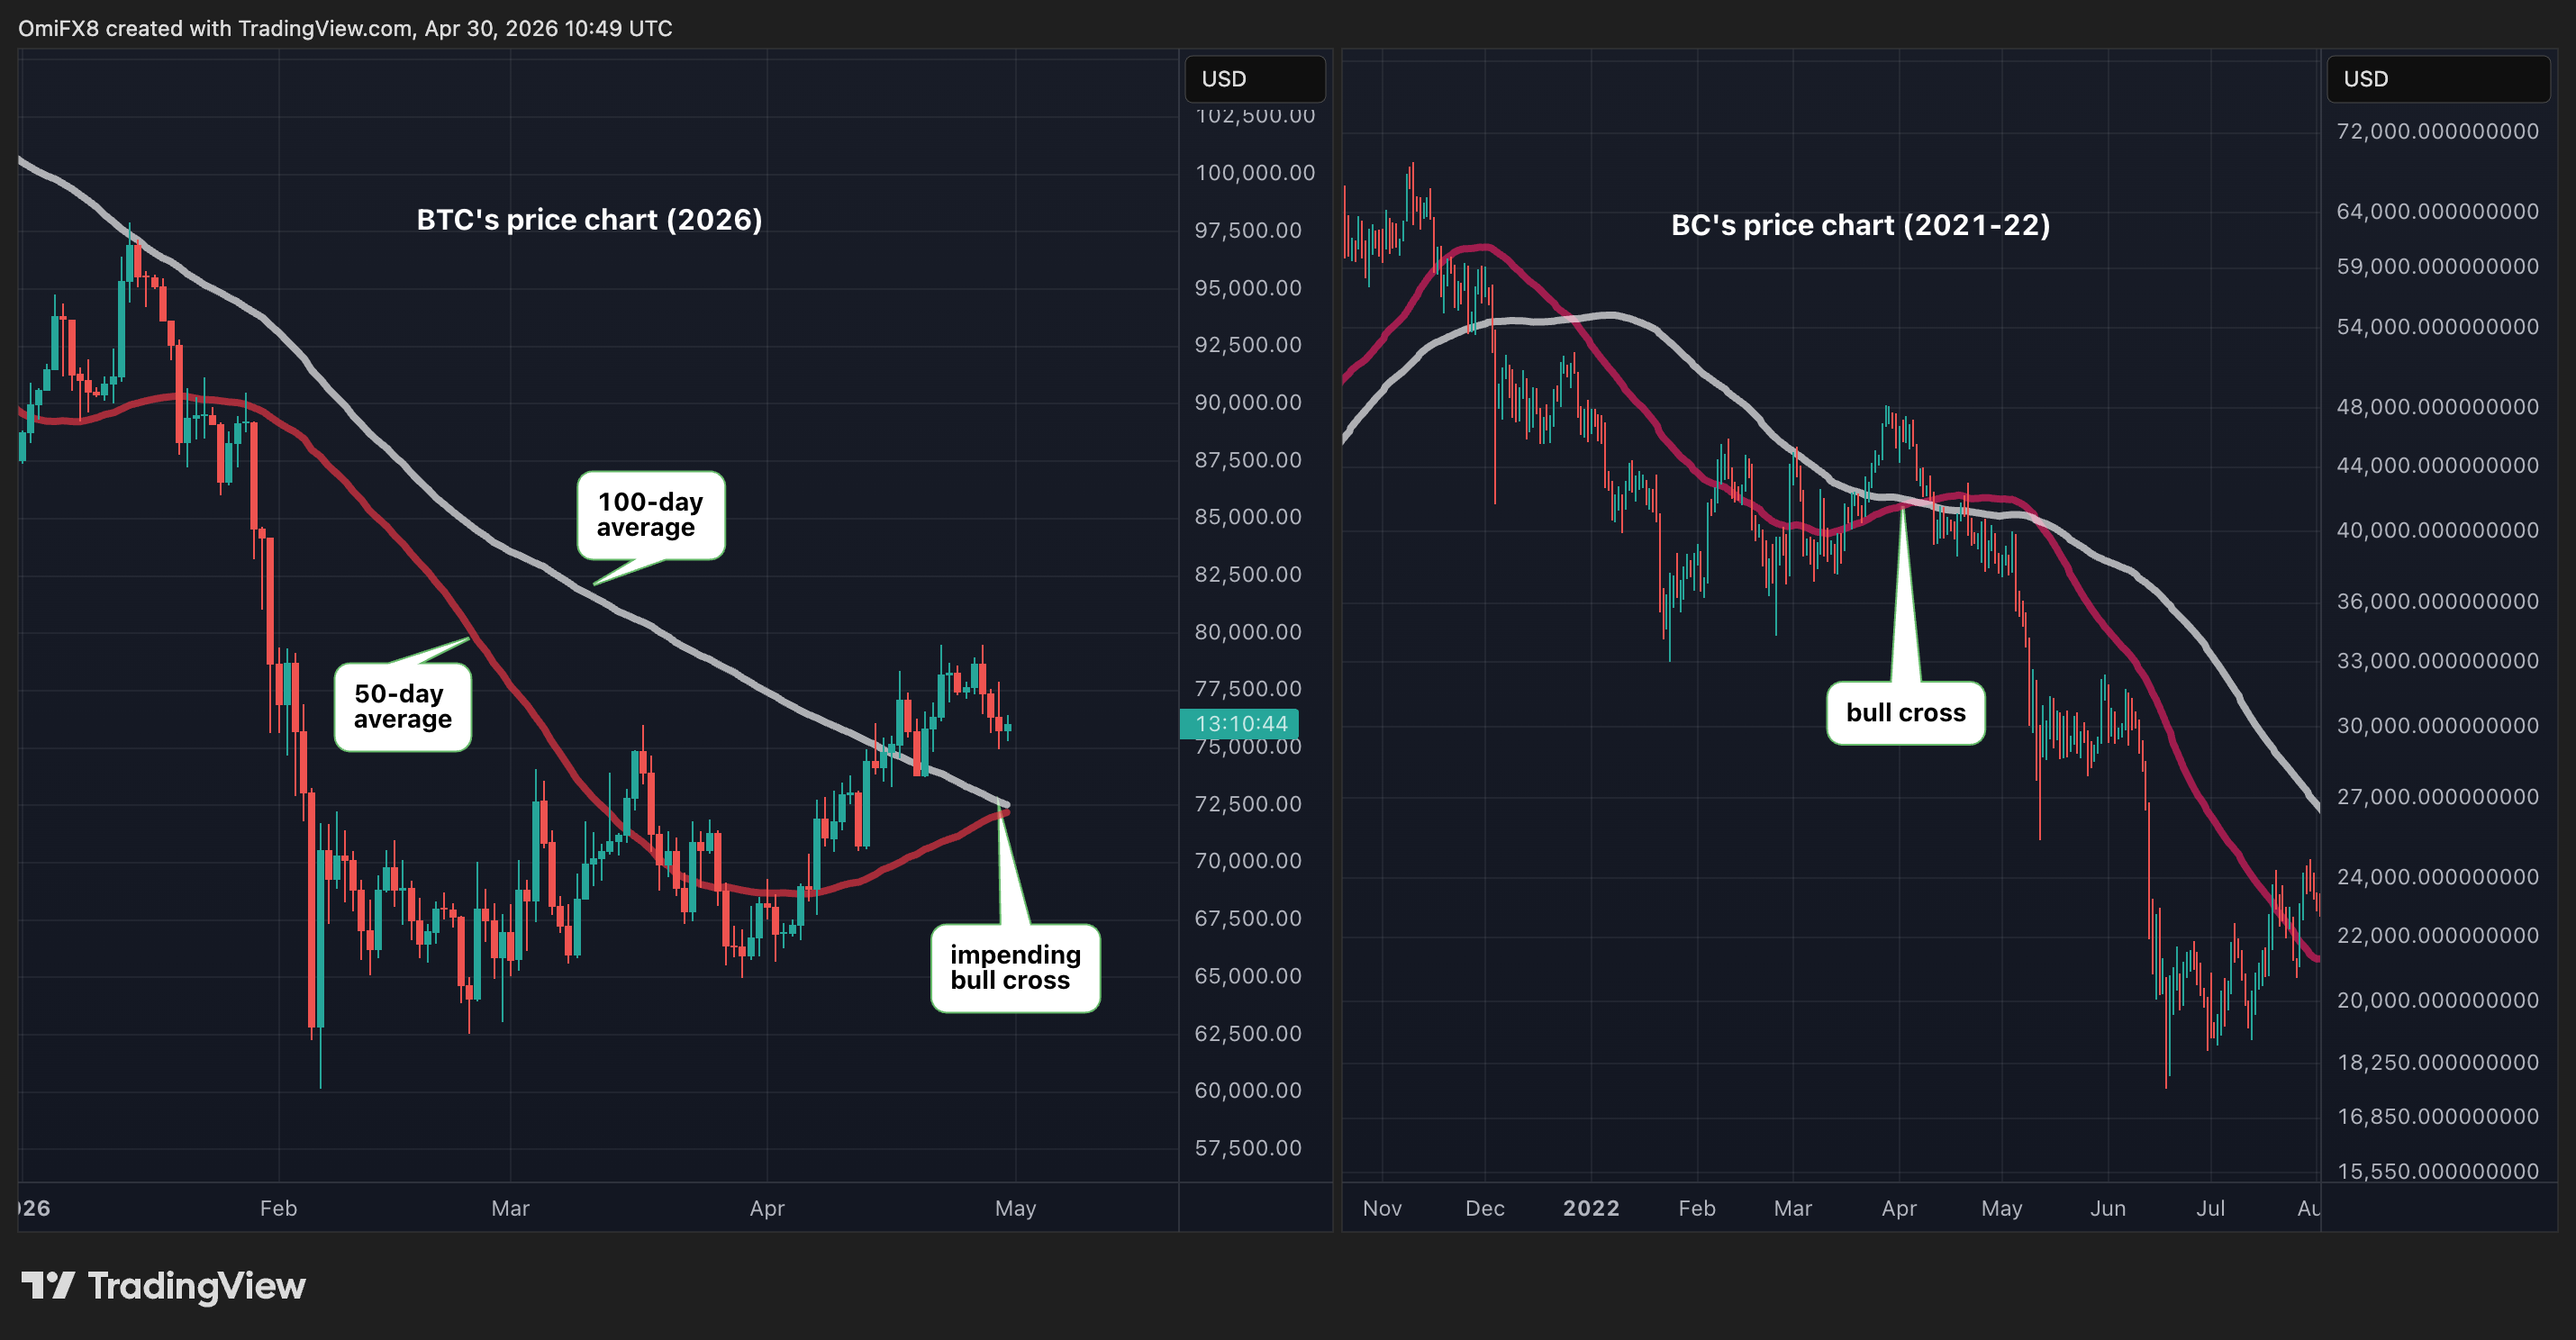
Technical Analysis: 50/100 Day Moving Average Bullish Crossover
In the charts, the 50-day average is preparing to cross above the 100-day average; this bullish crossover indicates strengthening short-term momentum and carries additional upside potential. Although the movement in 2026 gives similar signals compared to the 2021-22 period, caution is necessary as it can be misleading in bear markets. The table below summarizes the current levels:
| Level | Price | Score | Distance | Sources |
|---|---|---|---|---|
| S1 (Support) | 71.926,08$ | 69/100 ⭐ | -8,24% | Fibo 0.382, VAL, SMA 100 |
| S2 (Support) | 78.219,40$ | 62/100 ⭐ | -0,21% | Multiple |
| R1 (Resistance) | 79.431,42$ | 95/100 ⭐ | +1,33% | Fibo 0.618, BB Upper, Swing High |
| R2 (Resistance) | 84.650,36$ | 54/100 | +7,99% | Fib |
Analyst Warnings: Geopolitical and Liquidity Risks
Nansen analyst Jake Kennis notes that Bitcoin's failure to hold above 78 thousand dollars and retreat to 75 thousand dollars indicates that the "higher for longer" signal has been digested, and expects range-bound movement without a liquidity trigger. Energy analyst Anas Alhajji and 10X Research founder Markus Thielen emphasize that an Iran war and energy market disruptions could hit the global economy in May. These warnings may limit short-term upward movements. The continuation of institutional inflows in the sector and seasonality increase the likelihood of the upside remaining dominant.
Key Levels for BTC Investors
- R1 (79.431$): Breakout opens 84k target.
- S2 (78.219$): If it holds, sideways continues.
- RSI 61,47: Overbought risk low, momentum neutral.
COINOTAG does not provide financial advisory services. This content is for informational purposes only and should not be considered investment advice. Cryptocurrency investments involve high risk.
Add COINOTAG as a Preferred Source
Add COINOTAG to your preferred sources in Google News and Search to see our coverage first.
Add on GoogleRelated Tags
AI-generated, AI-reviewed, under COINOTAG editorial oversight.