

BTC Closed April at 76K: May Rally?
BTC/USDT
$17,270,179,225.19
$65,991.05 / $63,100.00
Change: $2,891.05 (4.58%)
+0.0056%
Longs pay

BTC April Close and Seasonal Trend
Bitcoin closed April at 76.110,83 dollars while following a cautious course. Historical data shows that the largest cryptocurrency usually rises in May; in the 13 years since 2013, it ended with gains seven times. Following the approximately 10% increase in April, this seasonal trend indicates that the general upward trend may continue. Net inflows of 1.8 billion dollars into US spot ETFs this month and 1.32 billion dollars in March reinforce the strength of institutional demand. For detailed BTC analysis, the S&P 500 trading near record levels also supports similar optimism.
BTC Technical Outlook and Current Data
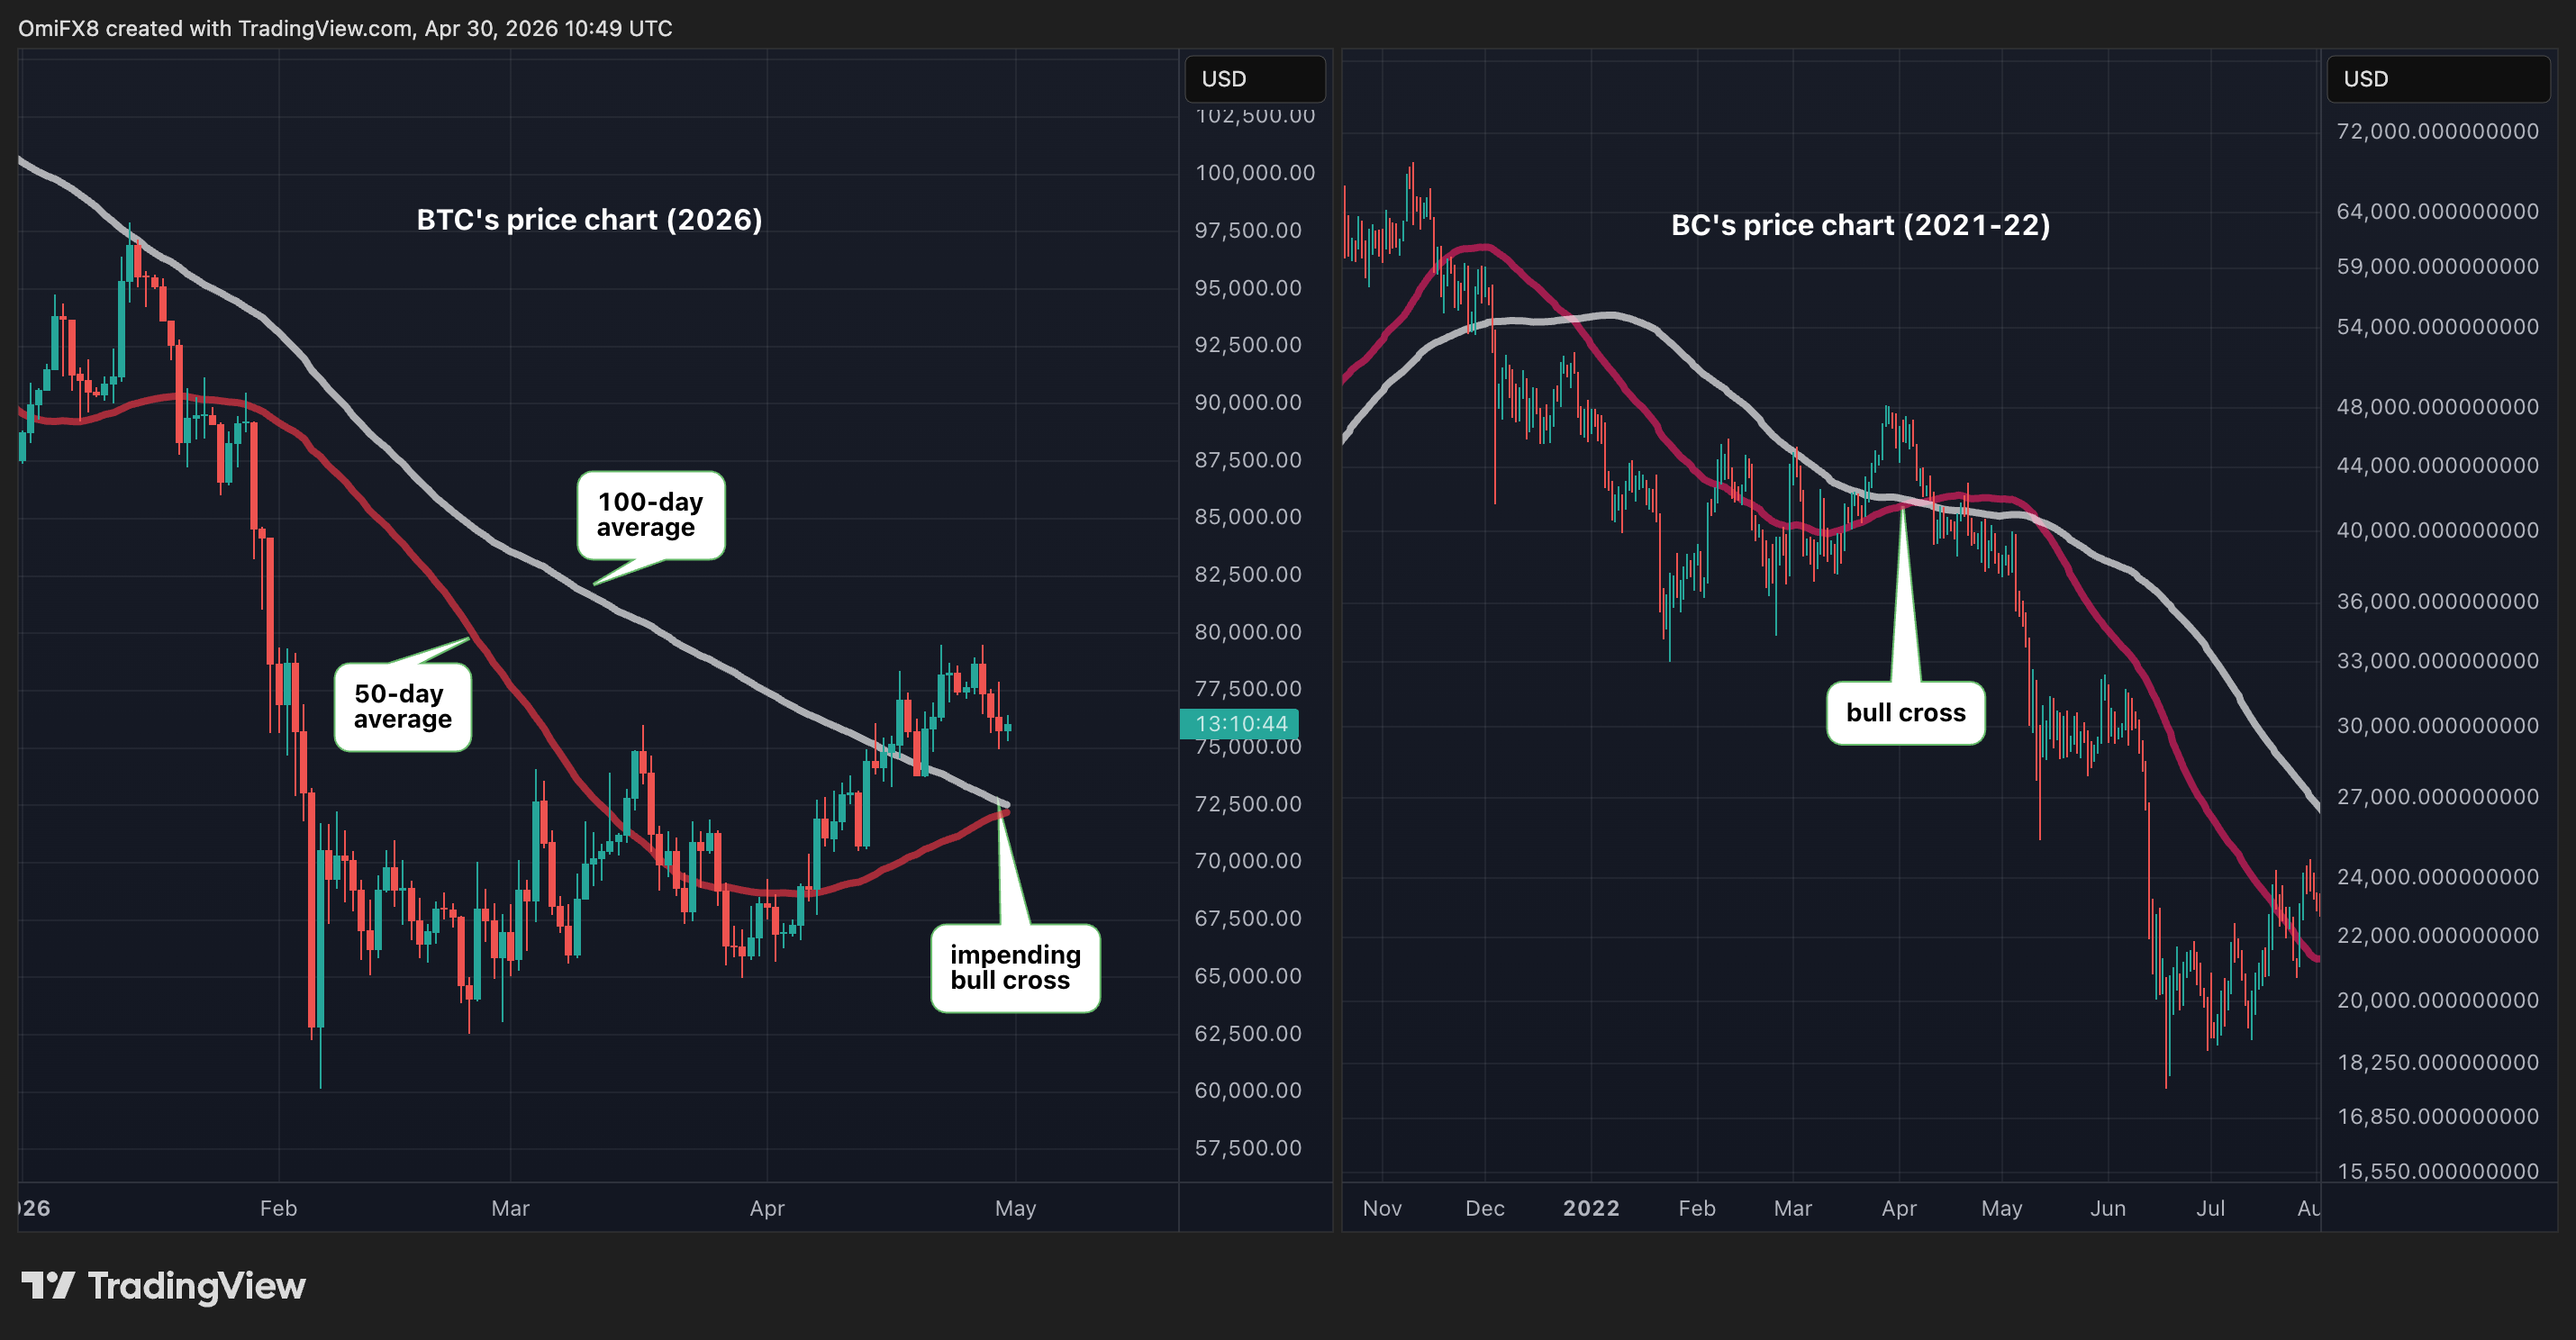
Current price: 76.309,09 USD (-0,49% 24s). RSI at 55.52 is neutral, trend sideways but Supertrend giving bearish signal. On charts, the 50-day average is preparing to cross above the 100-day average; this bullish crossover indicates strengthening short-term momentum and carries additional upside potential. EMA 20: 75.534 USD. Although the 2026 movement gives similar signals compared to the 2021-22 period, caution is required as it can be misleading in bear markets. BTC futures should be followed.
BTC Support/Resistance and Risks
The market is under pressure from rising bond yields; risky assets are struggling as the 30-year US Treasury yield approaches 5%. Nansen analyst Jake Kennis sees BTC's pullback to 75k if it cannot hold above 78k as a "higher for longer" signal. Supports: S1 75.575 USD (strong, %0,95 away), S2 71.951 USD. Resistances: R1 79.423 USD (strong, +%4,09), R2 77.222 USD. Energy analysts highlight the risk of war with Iran; although institutional inflows support the upside, there may be short-term limitations. Follow the BTC spot market.
COINOTAG does not provide financial advisory services. This content is for informational purposes only and should not be considered investment advice. Cryptocurrency investments involve high risk.
Add COINOTAG as a Preferred Source
Add COINOTAG to your preferred sources in Google News and Search to see our coverage first.
Add on GoogleRelated Tags
AI-generated, AI-reviewed, under COINOTAG editorial oversight.