

BTC ETFs Rebound with $562M Inflow, Price Below 78K
BTC/USDT
$11,825,624,338.83
$66,384.00 / $65,553.67
Change: $830.33 (1.27%)
-0.0001%
Shorts pay

Spot Bitcoin (BTC detailed analysis) ETFs attracted approximately $562 million in net inflows on Monday, ending a four-day outflow streak. Last week saw $1.5 billion in outflows, and since the beginning of the year, spot BTC ETFs have recorded a total of $4.6 billion in outflows, partially offset by $3.6 billion in inflows, resulting in a net outflow of $1 billion as of Tuesday (SoSoValue data). Although the BTC price fell below $75,000 over the weekend, it recovered above $79,000 on Monday (CoinGecko). The current price is at the $78,219 level, trading with a 0.67% increase in 24 hours.
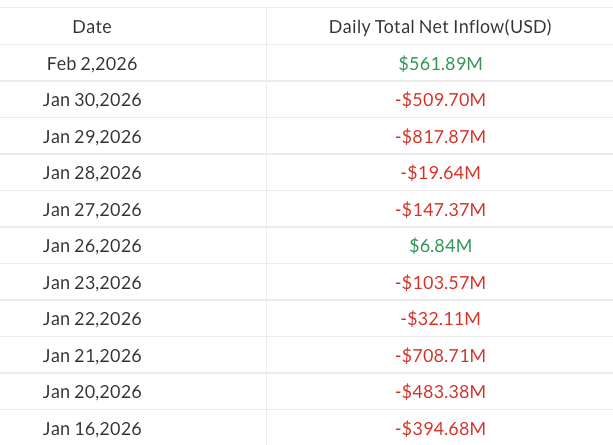
Bitcoin ETF flows since Jan. 16. Source: SoSoValue
Spot Bitcoin ETF Flows End Four-Day Outflow Streak
This inflow indicates that investor confidence is slowly returning. Despite a net $1 billion outflow since the beginning of the year, Monday's flow gave the market a breather. ETFs are monitored as a barometer of institutional demand.
BTC Price Fell Below MicroStrategy Cost Basis
Bitcoin fell below MicroStrategy's average cost basis of $76,037 for the first time since October 2023. It also dropped below $80,000 for the first time since April 2025. This decline stems from geopolitical tensions and US monetary policy uncertainty. Galaxy Digital Research Director Alex Thorn noted that BTC is trading 7.3% below the ETF average creation cost of $84,000, a level crossed for the first time since summer and fall 2024.
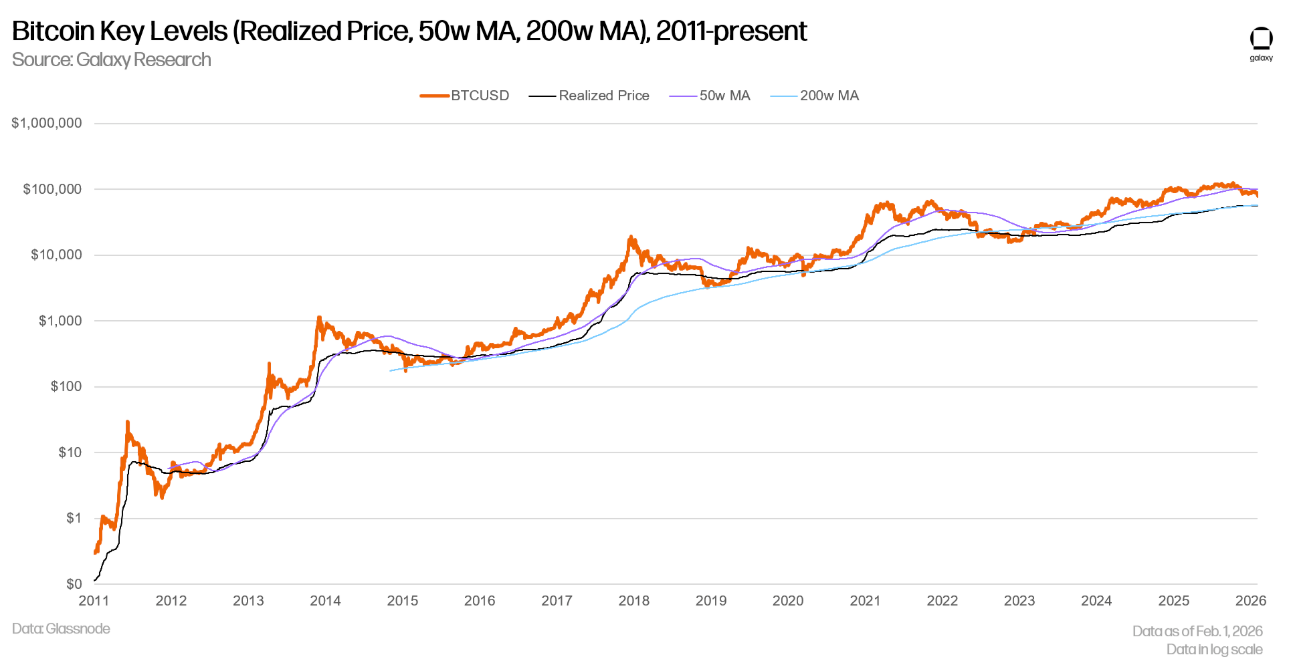
Bitcoin Key Levels (realized price, 50-week moving average, 200-week moving average) since 2011. Source: Galaxy Research, Glassnode
Technical Indicators: RSI Oversold, Strong Supports Nearby
RSI at 28.50 is in oversold territory, signaling a downtrend and bearish Supertrend. EMA 20: $85,621. Strong supports: $74,604 (S1, 75% score), $77,503 (S2, 61% score). Resistances: $79,364 (R1, 70% score), $82,602 (R2). BTC futures may test these levels.
ETH ETF Outflows and Market Pressures
Ether (ETH) ETFs recorded a light outflow of $2.9 million on Monday. CoinShares Research Director James Butterfill highlighted negative capital flows, geopolitical tensions, and Fed uncertainty. Last week, there were $1.7 billion outflows from crypto exchange-traded products.
COINOTAG does not provide financial advisory services. This content is for informational purposes only and should not be considered investment advice. Cryptocurrency investments involve high risk.
Add COINOTAG as a Preferred Source
Add COINOTAG to your preferred sources in Google News and Search to see our coverage first.
Add on GoogleRelated Tags
AI-generated, AI-reviewed, under COINOTAG editorial oversight.