

BTC Volume Declining: Fed and Oil Risks
BTC/USDT
$18,394,391,084.39
$65,799.00 / $63,100.00
Change: $2,699.00 (4.28%)
+0.0030%
Longs pay

While expectations for Bitcoin (BTC) to climb to new highs are rising, trading volume in the spot market is showing a clear slowdown signal. According to Glassnode data, daily BTC trading volume has fallen below 8 billion dollars in recent periods; this is the lowest level seen since October 2023 when BTC was trading below 40,000 dollars. Volume has been steadily contracting since the peaks exceeding 25 billion dollars at the beginning of February. Low-volume environments typically thin out market depth and increase sensitivity to flow changes. This situation opens the door to irregular fluctuations in prices.
Dramatic Contraction in BTC Spot Volume
Market depth is measured by buy and sell orders within a 2% band from the current price; it reflects liquidity's capacity to absorb large orders at stable prices. When depth shrinks, a few large orders can sharply affect the price. This contraction in volume can fuel volatility. Current BTC price at 77,151.67 USD level (%1.11 24-hour change), RSI 59.40 wandering in the neutral zone while trend is sideways, Supertrend giving bearish signal. Trading below EMA 20: 75,625 USD.
Fed Interest Rate Decision and BTC Volatility Index
However, options traders are currently forecasting a calm course; Volmex's BVIV index, as an indicator measuring BTC's 30-day expected swings, fell below annualized 42% making a three-month low. Today, the Fed's interest rate decision is on the agenda; although no change is expected, clues in the policy text regarding energy market disruptions and fuel price hikes will be closely watched. A hawkish tone, emphasizing growth and inflation risks, could delay rate cuts. Marex analysts note that BTC is cautiously holding around 77,000 dollars ahead of the Fed, liquidity is thinning, and the next move will come from macro factors. For detailed BTC spot analysis, check here.
Technical Support and Resistance Levels
| Level | Price (USD) | Score | Distance | Sources |
|---|---|---|---|---|
| S1 | 76,440.91 | 83/100 ⭐ | -1.47% | S1, Fibo 0.500, Prev Day Close |
| S2 | 72,633.36 | 71/100 ⭐ | -6.38% | SMA 100, HVN 5, Fibo |
| R1 | 80,313.66 | 74/100 ⭐ | +3.52% | Fibo 0.618, Swing High, Donchian Upper |
| R2 | 78,262.15 | 69/100 ⭐ | +0.88% | R1, MACD Cross |
These strong levels increase breakout risk in low volume. Check the futures market for BTC futures.
Pressure from Oil and Bond Yields on BTC
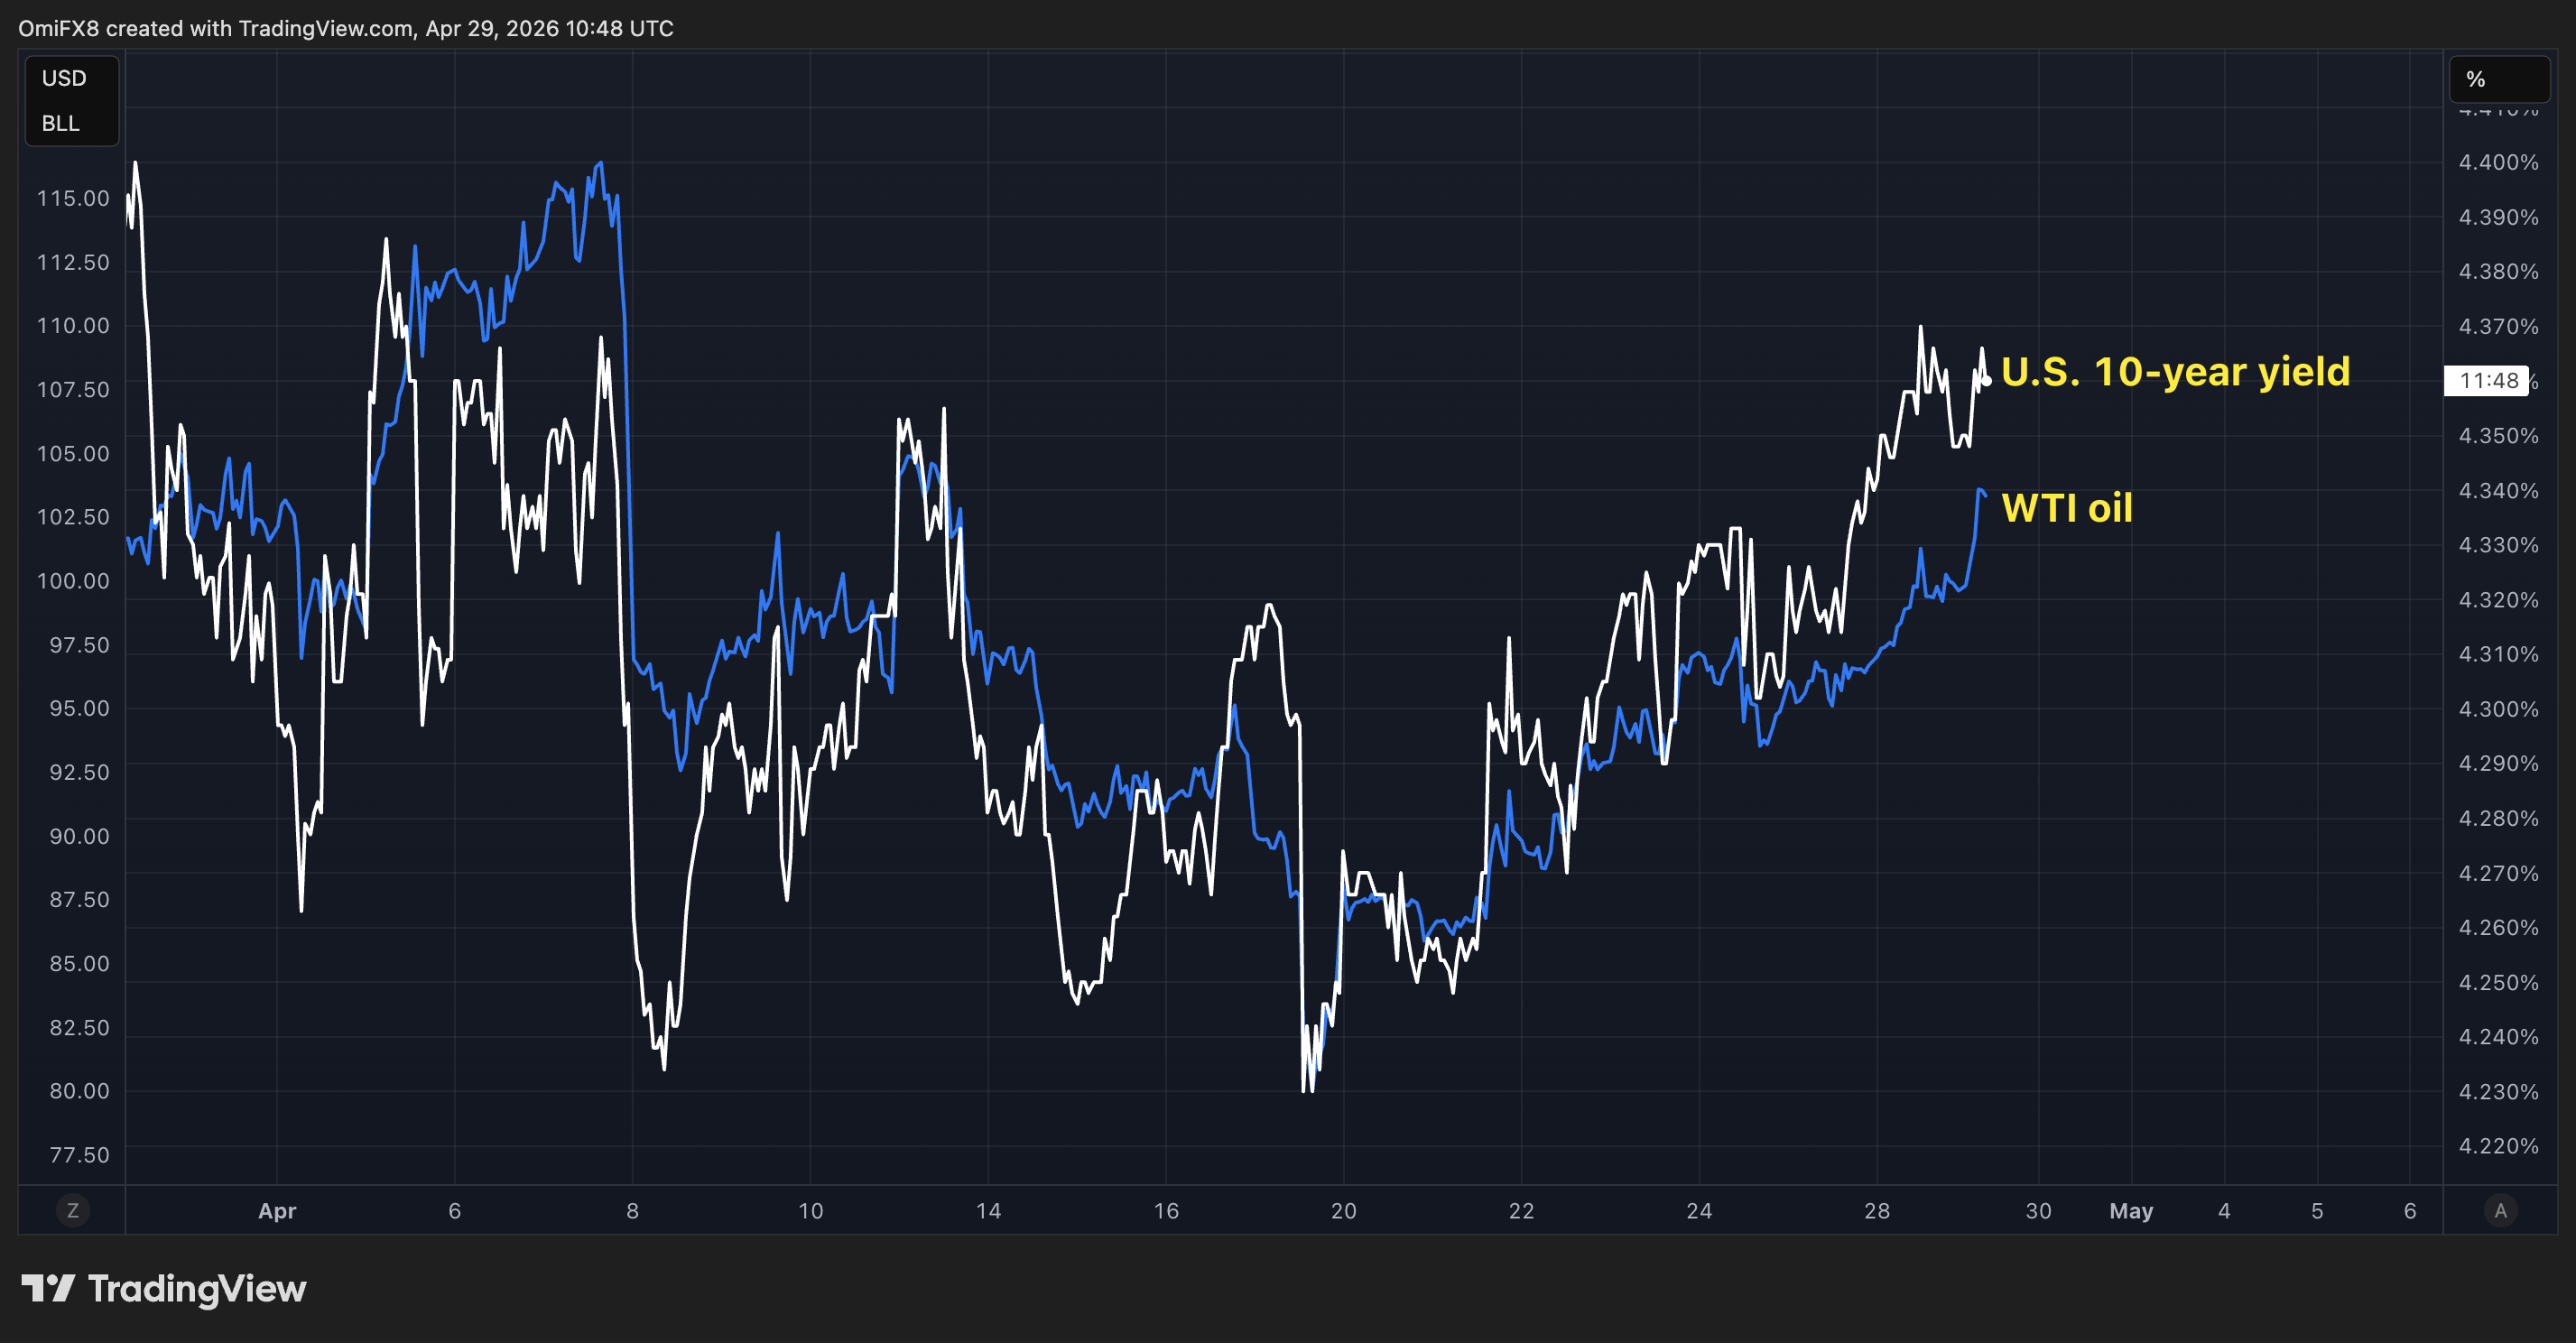
Volatility in oil prices is dominating all asset classes; the 10-year US Treasury yield is showing synchronized swings with WTI crude oil. As this rate, seen as risk-free return in traditional finance, rises, overall borrowing costs increase and financial conditions tighten. If crude oil climbs further, the yield wave could shake crypto markets too; energy uncertainties make risk appetite sensitive to headlines.
Related Cryptos: SOL, XRP and Altcoin Movements
Ether (ETH), Solana (SOL), XRP along with memecoin and computation indices are following the market with slight rises; in traditional markets, the dollar index remains weak below 100, while 10- and 2-year US Treasury yields are slowly climbing. For SOL and XRP, check detailed SOL analysis; while low volume dominates BTC, opportunity signals may form in altcoins.
Strategic Recommendations for BTC Investors
- Avoid large orders in low volume.
- Monitor R1 (80,313 USD) resistance for post-Fed volatility.
- If oil rally triggers bond yields, be prepared for S1 support (76,440 USD).
COINOTAG does not provide financial advisory services. This content is for informational purposes only and should not be considered investment advice. Cryptocurrency investments involve high risk.
Add COINOTAG as a Preferred Source
Add COINOTAG to your preferred sources in Google News and Search to see our coverage first.
Add on GoogleRelated Tags
AI-generated, AI-reviewed, under COINOTAG editorial oversight.