Has Ethereum Ended Its Bearish Movement? Current ETH Analysis!
ETH/USDT
$15,177,860,732.08
$2,194.82 / $2,090.56
Change: $104.26 (4.99%)
+0.0010%
Longs pay

Contents
- Ethereum experienced a drop of more than 2% today.
- Will Ethereum’s price continue to decline?
- If ETH cannot stay above $1780, how far will the drop continue?
Will Ethereum drop to $1700? What are the important levels that Ethereum investors should follow? Current ETH analysis!
Medium-Term ETH Price Analysis!
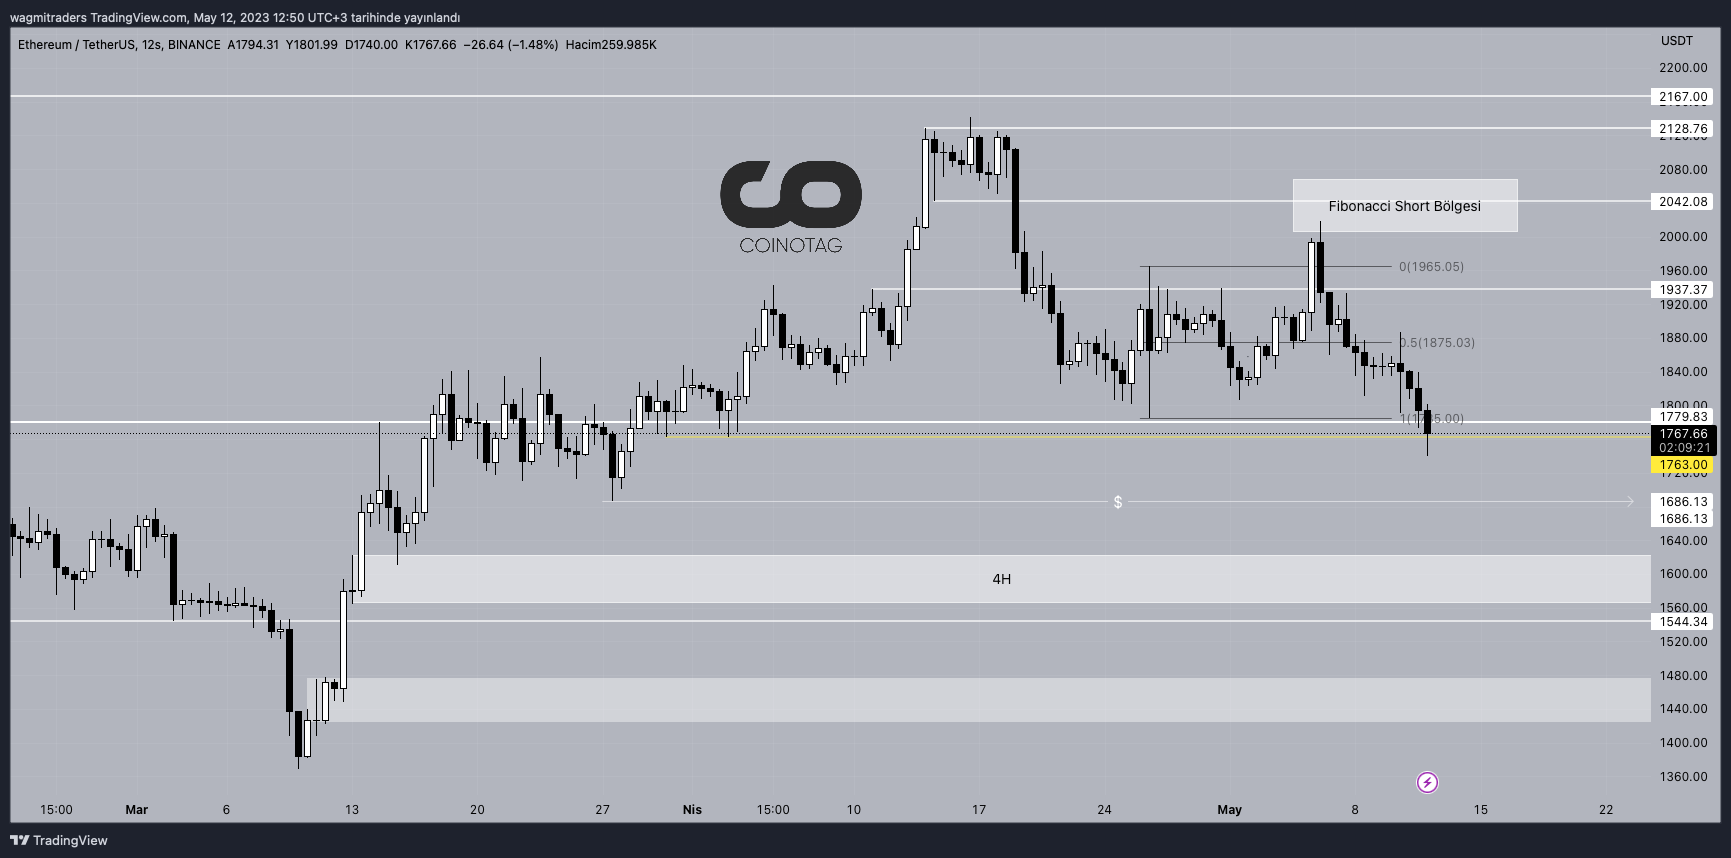
12 Hour ETH Price Chart Source: TradingView
When we examine the Ethereum price chart, we see that it dropped below the important support level of $1780 and fell to around $1740.
In our previous ETH analysis, we mentioned that if Ethereum continued to close below the $1874 level for 4-hour and daily candles, it could drop to the $1780 level.
Click here to see our previous Ethereum analysis.
If we update the Ethereum analysis, we can see that the ETH price has cleared the long liquidations below the $1763 level and is trying to push the price back above the $1780 level.
If the ETH price can close daily candles above the $1780 level mentioned in the analysis, it could rise to the $1940 level again.
If the ETH price cannot close daily candles above the $1780 level, it could continue to drop to the $1686 level.
Add COINOTAG as a Preferred Source
Add COINOTAG to your preferred sources in Google News and Search to see our coverage first.
Add on GoogleRelated Tags
Comments
Other Articles
Ethereum Foundation Hit by More Exits as ETPs Bleed $249M, Verus Bridge Loses $11M
May 18, 2026 at 05:37 PM UTC
Ethereum Founder Vitalik Buterin Says AI Verification Could Help Secure Crypto Networks
May 18, 2026 at 05:34 PM UTC
The Ethereum Foundation is facing a wave of high-profile departures as its internal shakeup deepens
May 18, 2026 at 05:34 PM UTC