

Bitcoin Slides Below $68K as Strategy Sells, ETFs Bleed $3.4B and $55K Odds Climb
BTC/USDT
$7,316,191,144.41
$63,555.00 / $62,275.00
Change: $1,280.00 (2.06%)
+0.0066%
Longs pay

Bitcoin News
Sentiment across prediction markets has flipped decisively bearish on Bitcoin over the past 48 hours. Users on Myriad now assign a 53% probability that BTC slides to $55,000 before reclaiming $84,000, a sharp reversal from the 62% upside skew recorded on Monday. The shift mirrors price action on spot venues, where Bitcoin shed more than 5% in the last 24 hours to trade near $67,312 and is down roughly 12% on the week. With BTC trading 46% below the $126,080 all-time high, short-term traders are repricing tail risk to the downside.

A key catalyst for the shift in conviction was Strategy's first Bitcoin sale since 2022. Michael Saylor's firm offloaded 32 BTC worth approximately $2.5 million last week, a symbolic break in a buying streak that had accumulated over $57 billion in BTC reserves. Analysts had previously warned that any sell signal from the largest corporate holder would immediately puncture treasury-conviction narratives. That warning has proved prescient: derivatives desks reported a sharp widening of perpetual funding skews within hours of the disclosure, with leveraged longs absorbing the brunt of the unwind as price discovery accelerated lower.
Spot ETF flows have added structural pressure. US-listed Bitcoin ETFs are now on an 11-day outflow streak, with more than $3.4 billion redeemed from the products over that window. The cumulative drag has flipped the entire complex negative on the year, meaning aggregate redemptions in 2026 now exceed inflows since January. The reversal undermines a core bullish argument from the first quarter, when steady ETF demand was cited as the floor under prices. With institutional flows turning seller, the bid that absorbed earlier dips has thinned materially.
Derivatives positioning compounded the damage. On-chain liquidation data shows nearly $600 million in BTC long positions were wiped out in the last 24 hours alone, as cascading margin calls forced market-makers to dump inventory into a falling tape. Bitcoin slipped below $68,000 for the first time since April 5, marking a clean break of the multi-week consolidation range that traders had treated as the lower bound of a healthy correction. The breach now exposes deeper liquidity pockets, and open interest has not yet flushed enough to suggest capitulation is complete.
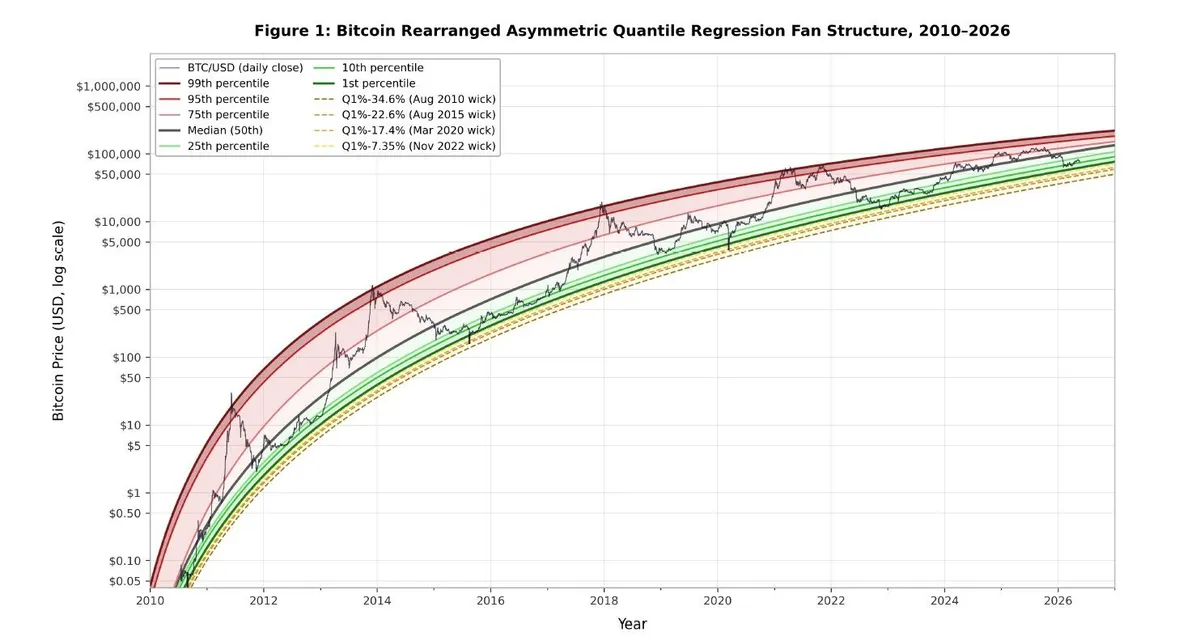
Against this backdrop, quantitative analyst Benjamin Cowen has published a new statistical framework that quantifies why aggressive cycle peaks keep undershooting. His paper, titled Asymmetric Tail Curvature in Bitcoin Price Quantiles, draws on 16 years of daily data through May 2026 and fits a fan of quantile bands rather than a single power-law line. The headline finding: upper bands tracing speculative peaks bend inward over time with a curvature of roughly minus 0.33, while lower bands tracing structural support remain effectively straight at minus 0.02, statistically indistinguishable from zero.
The model carries a blunt implication for legacy frameworks. Cowen benchmarked three of the best-known long-term Bitcoin models against the 2019-2026 price record and found all three were systematically too optimistic. The original power-law fit overshot actual price on 77.2% of trading days with an average error of 32.1%. PlanB's stock-to-flow overshot on 94.9% of days with a 294.5% error, and the S2FX variant implied valuations above $5 million per coin. Cowen attributes the misses to early reflexivity assumptions that no longer hold in a market dominated by trillion-dollar institutional flows.
Technically, BTC at $67,292 sits below the immediate support shelf at $66,862, with deeper liquidity at $64,829 and $62,510 as the next downside checkpoints. Resistance is layered at $68,594, $70,196 and $72,641. The RSI reading of 22.63 is deeply oversold and historically marks zones where reflex bounces appear, yet the MACD remains firmly bearish, confirming the active downtrend. A reclaim of $68,594 on rising volume would be the first credible sign that sellers are exhausted; failure to hold $66,862 likely opens a path to the $64,800 area. Until ETF outflows stabilize, oversold readings alone are unlikely to mark the bottom.
COINOTAG does not provide financial advisory services. This content is for informational purposes only and should not be considered investment advice. Cryptocurrency investments involve high risk.
Add COINOTAG as a Preferred Source
Add COINOTAG to your preferred sources in Google News and Search to see our coverage first.
Add on GoogleRelated Tags
AI-generated, AI-reviewed, under COINOTAG editorial oversight.