

Bitcoin Rises to 78K: Tech Rally and Fed Impact
BTC/USDT
$13,776,398,309.93
$64,744.81 / $63,269.28
Change: $1,475.53 (2.33%)
+0.0068%
Longs pay

Bitcoin jumped to 78.209 dollars, lifting risky assets alongside the earnings reports of US tech giants. Apple's (AAPL) report reinforced optimism across the industry and drew investors back to stocks and BTC detailed analysis currencies. Since the beginning of this week, competitors like Alphabet (GOOG), Microsoft (MSFT), Meta (META), and Amazon (AMZN) also announced double-digit revenue growth. Markets recovered with confidence in the AI growth story, while the rise currently reflects relief buying.
Bitcoin's Rise to 78K with Tech Giants Rally
Crypto markets showed resilience despite rising oil prices and 400 million dollar outflows from spot Bitcoin ETFs. Current price 78.209,56 USD, 24-hour change +%2,72. Iran tensions and disruptions in the Strait of Hormuz pushed crude oil higher, increasing inflation pressure. Under these conditions, BTC's sideways trend and RSI at 60,91 level indicate the market's balanced stance.
How Did the Fed Interest Rate Decision and Powell's Departure Affect BTC?
The Federal Reserve kept rates steady in the %3,50-%3,75 band; dissent from the most members since 1992, four in total, stood out. Fed Chair Jerome Powell's departure on May 15 and Kevin Warsh managing the June FOMC could trigger volatility. Mercado Bitcoin emphasized that short-term pressures stem from mixed structural factors, while research head Rony Szuster noted that volatility will remain sensitive to economic data, with institutional flows being decisive in the medium term.
BTC Support and Resistance Levels: Critical Thresholds
| Level | Price (USD) | Score | Distance | Sources |
|---|---|---|---|---|
| S1 (Strong) | 71.926 | 73/100 ⭐ | -7,99% | Fibo 0.382, Value Area Low, SMA 100, BB Lower |
| S2 (Strong) | 75.748 | 71/100 ⭐ | -3,10% | ATR Lo |
| R1 (Very Strong) | 79.388 | 96/100 ⭐ | +1,55% | R1, Fibo 0.618, Donchian Upper, Swing High |
| R2 (Medium) | 81.879 | 55/100 | +4,74% | R3, BB Up |
The 80.000 dollar level continues to be a critical threshold; if breached, new buyers will enter.
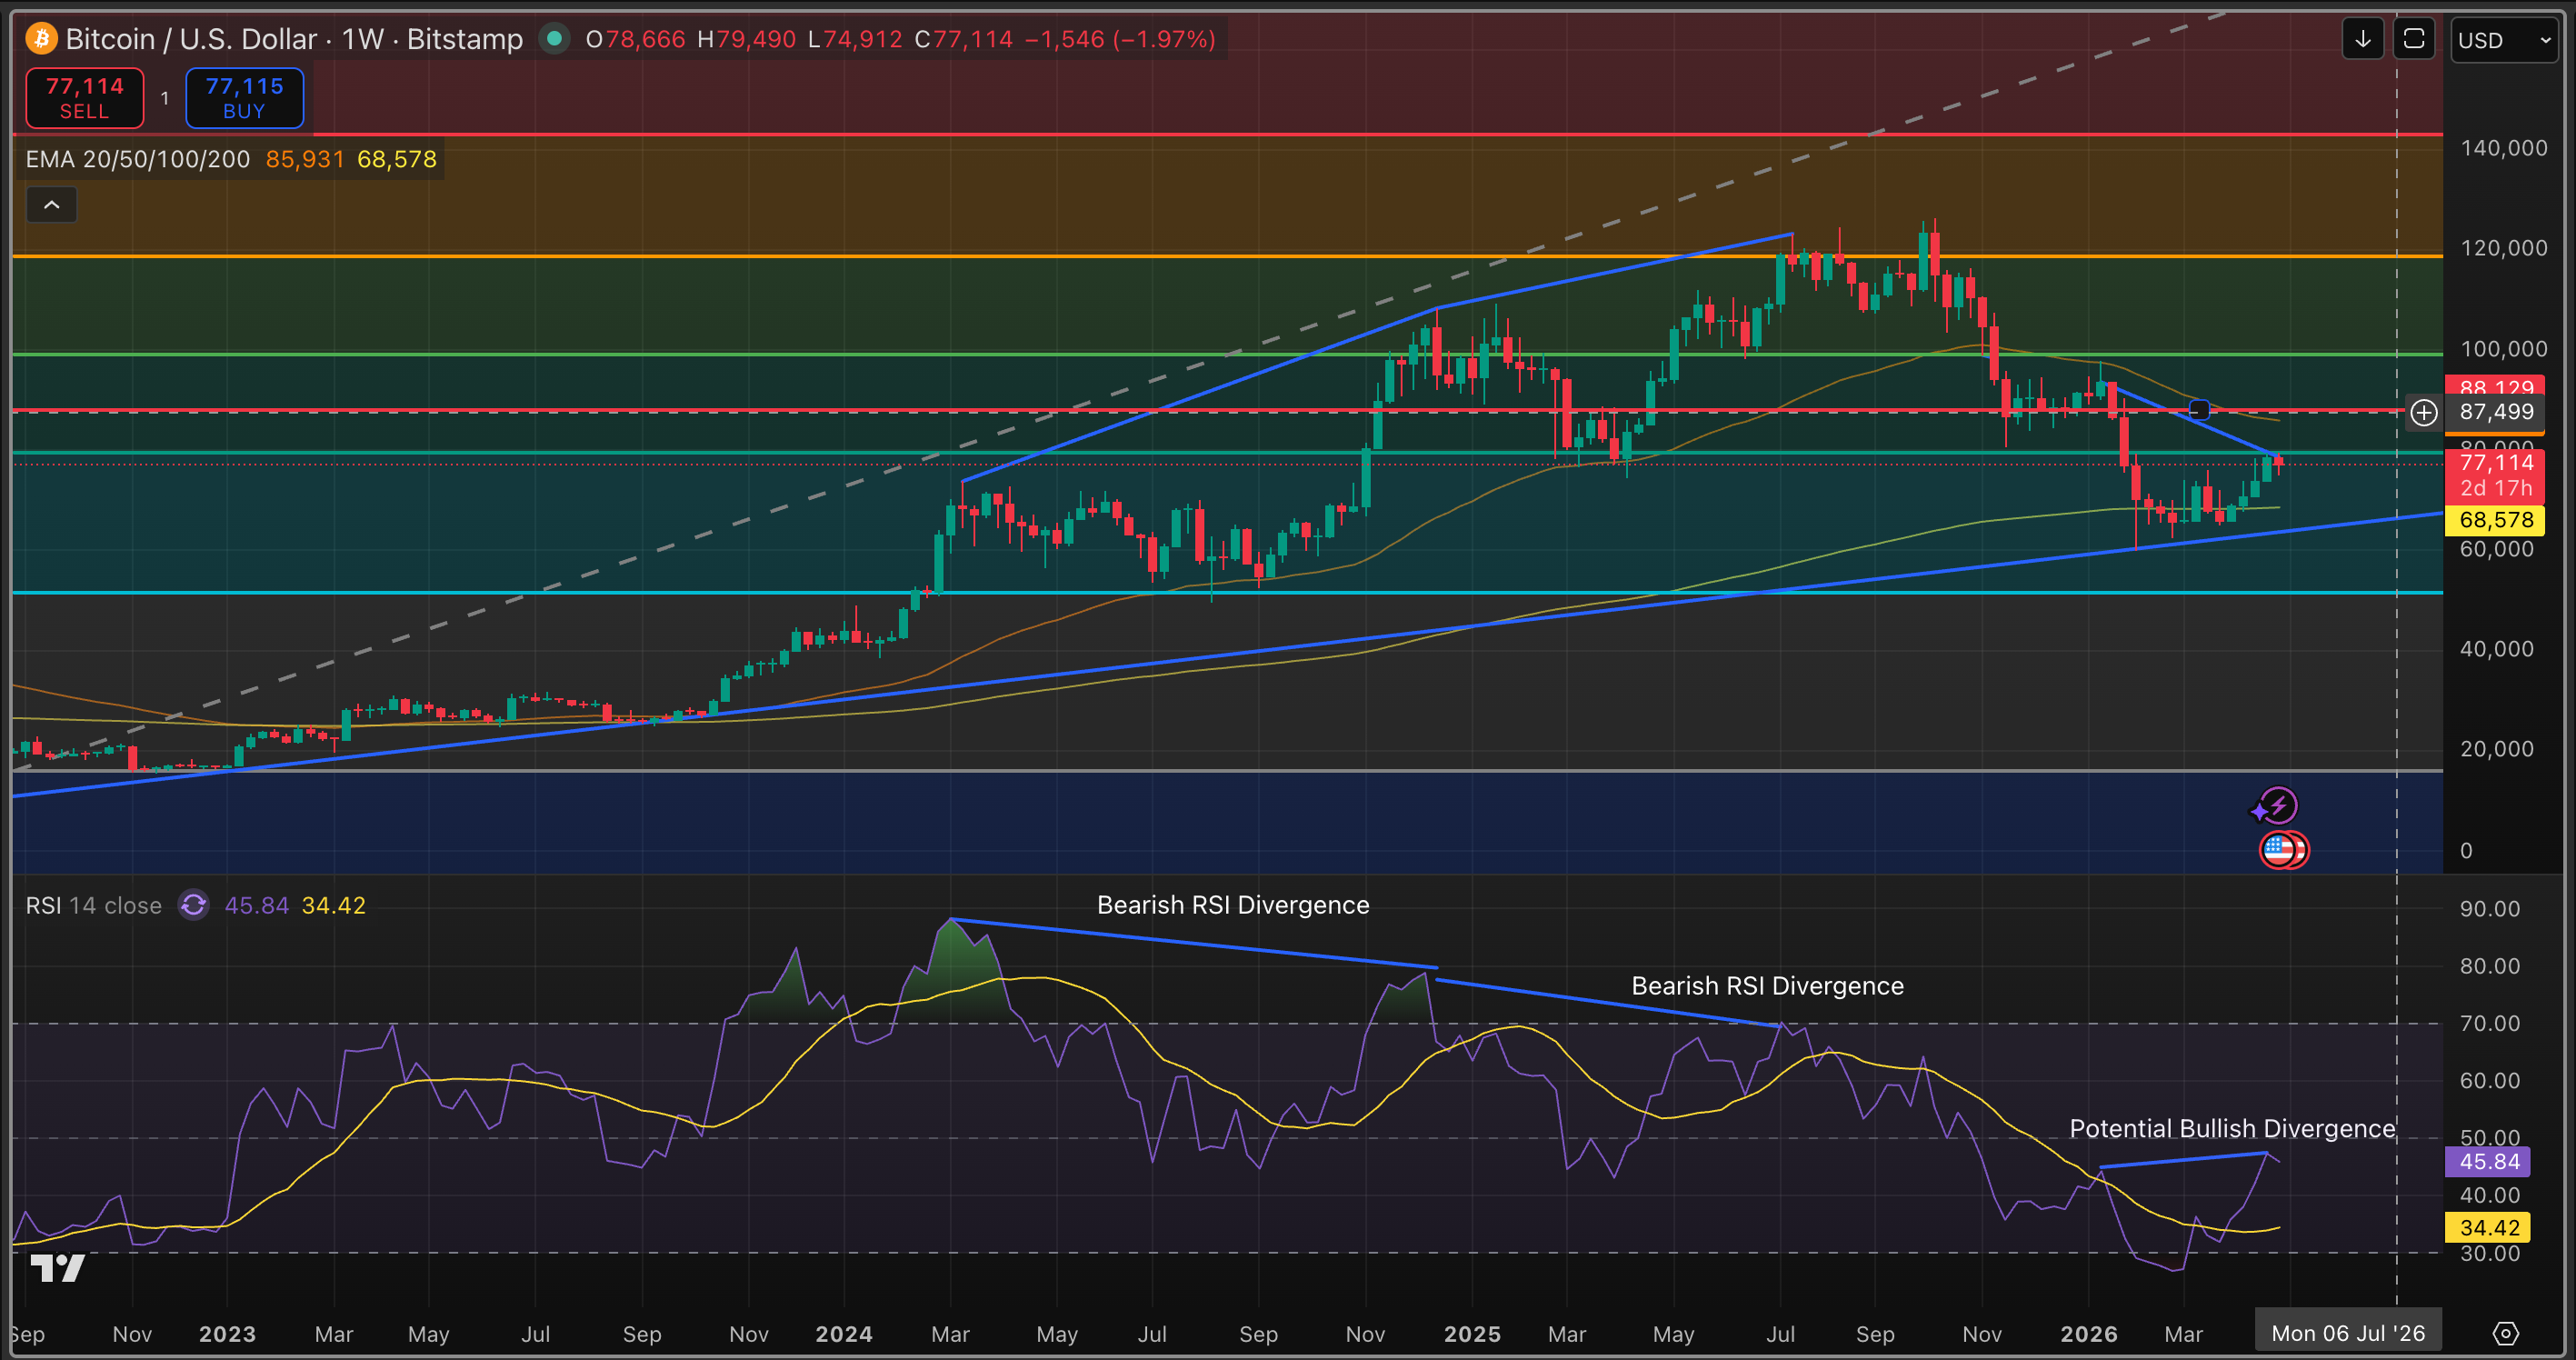
Bitcoin Technical Analysis: RSI Bullish Divergence and EMAs
On the weekly Bitcoin chart, while testing the 80.000 dollar resistance, a bullish divergence signal appeared on RSI; price made a lower low while the indicator held higher, but awaiting confirmation with weekly close. EMA 20: 75.789,54; Supertrend giving bearish signal. Consolidation dominates with the 200-day exponential moving average at 68.000 dollars. This data serves as a warning for leveraged traders in BTC futures.
Are Altcoins and Shitcoins Joining the BTC Rally?
- Altcoins (ALT) rose +%1,5 in parallel with BTC, but volume is low.
- Shitcoins volatile; BTC dominance fell to %55.
- Institutional flows may shift to ETH ETFs, supporting BTC.
COINOTAG does not provide financial advisory services. This content is for informational purposes only and should not be considered investment advice. Cryptocurrency investments involve high risk.
Add COINOTAG as a Preferred Source
Add COINOTAG to your preferred sources in Google News and Search to see our coverage first.
Add on GoogleRelated Tags
AI-generated, AI-reviewed, under COINOTAG editorial oversight.